
SEP 2025
Blockchain
Dashboard
Company
Carvana
My Role
Lead Designer
Platform
iOS App
Timeline
~ 6 weeks
Responsibilities
Design Direction
Research
Interaction Design
Visual Design
Prototyping
Overview
The truck drivers are a critical part of Carvana’s logistics chain. Their job? Haul cars from Carvana locations to customers’ homes across the U.S., making sure each vehicle arrives on time and in great condition.
To do this, the drivers previously had to use Quintiq Mobile — a clunky third-party app that was hard to use, missing key features, and rated the worst among Carvana’s internal tools (2.4 out of 5).
The business also couldn’t track vehicle locations or manage damages, leading to delays and even lost inventory. And despite all these issues, we were paying millions in licensing fees for it.
We wanted to fix it but we couldn’t. It wasn’t our app.
So the team decided to build a new one from scratch.
And I was tasked with leading the designs for it.

Our goals
Business
Reduce costs by replacing the third-party app and improve operational efficiency.
User
Improve the driver experience by making trips easier to manage and complete.
Challenges from the start
I had Quintiq Mobile as a reference, but it wasn’t very helpful. The experience was poor, and it lacked the features and flexibility we needed.
Making the task even harder was that I had to design it fast. The product team was already behind schedule, and we had less than two months to settle on the designs.
The team had feature ideas but weren’t sure how to fit them into the new workflow. So I took initiative and led the design approach by forming the research plan and working closely with stakeholders to shape the vision and drive alignment throughout the project.
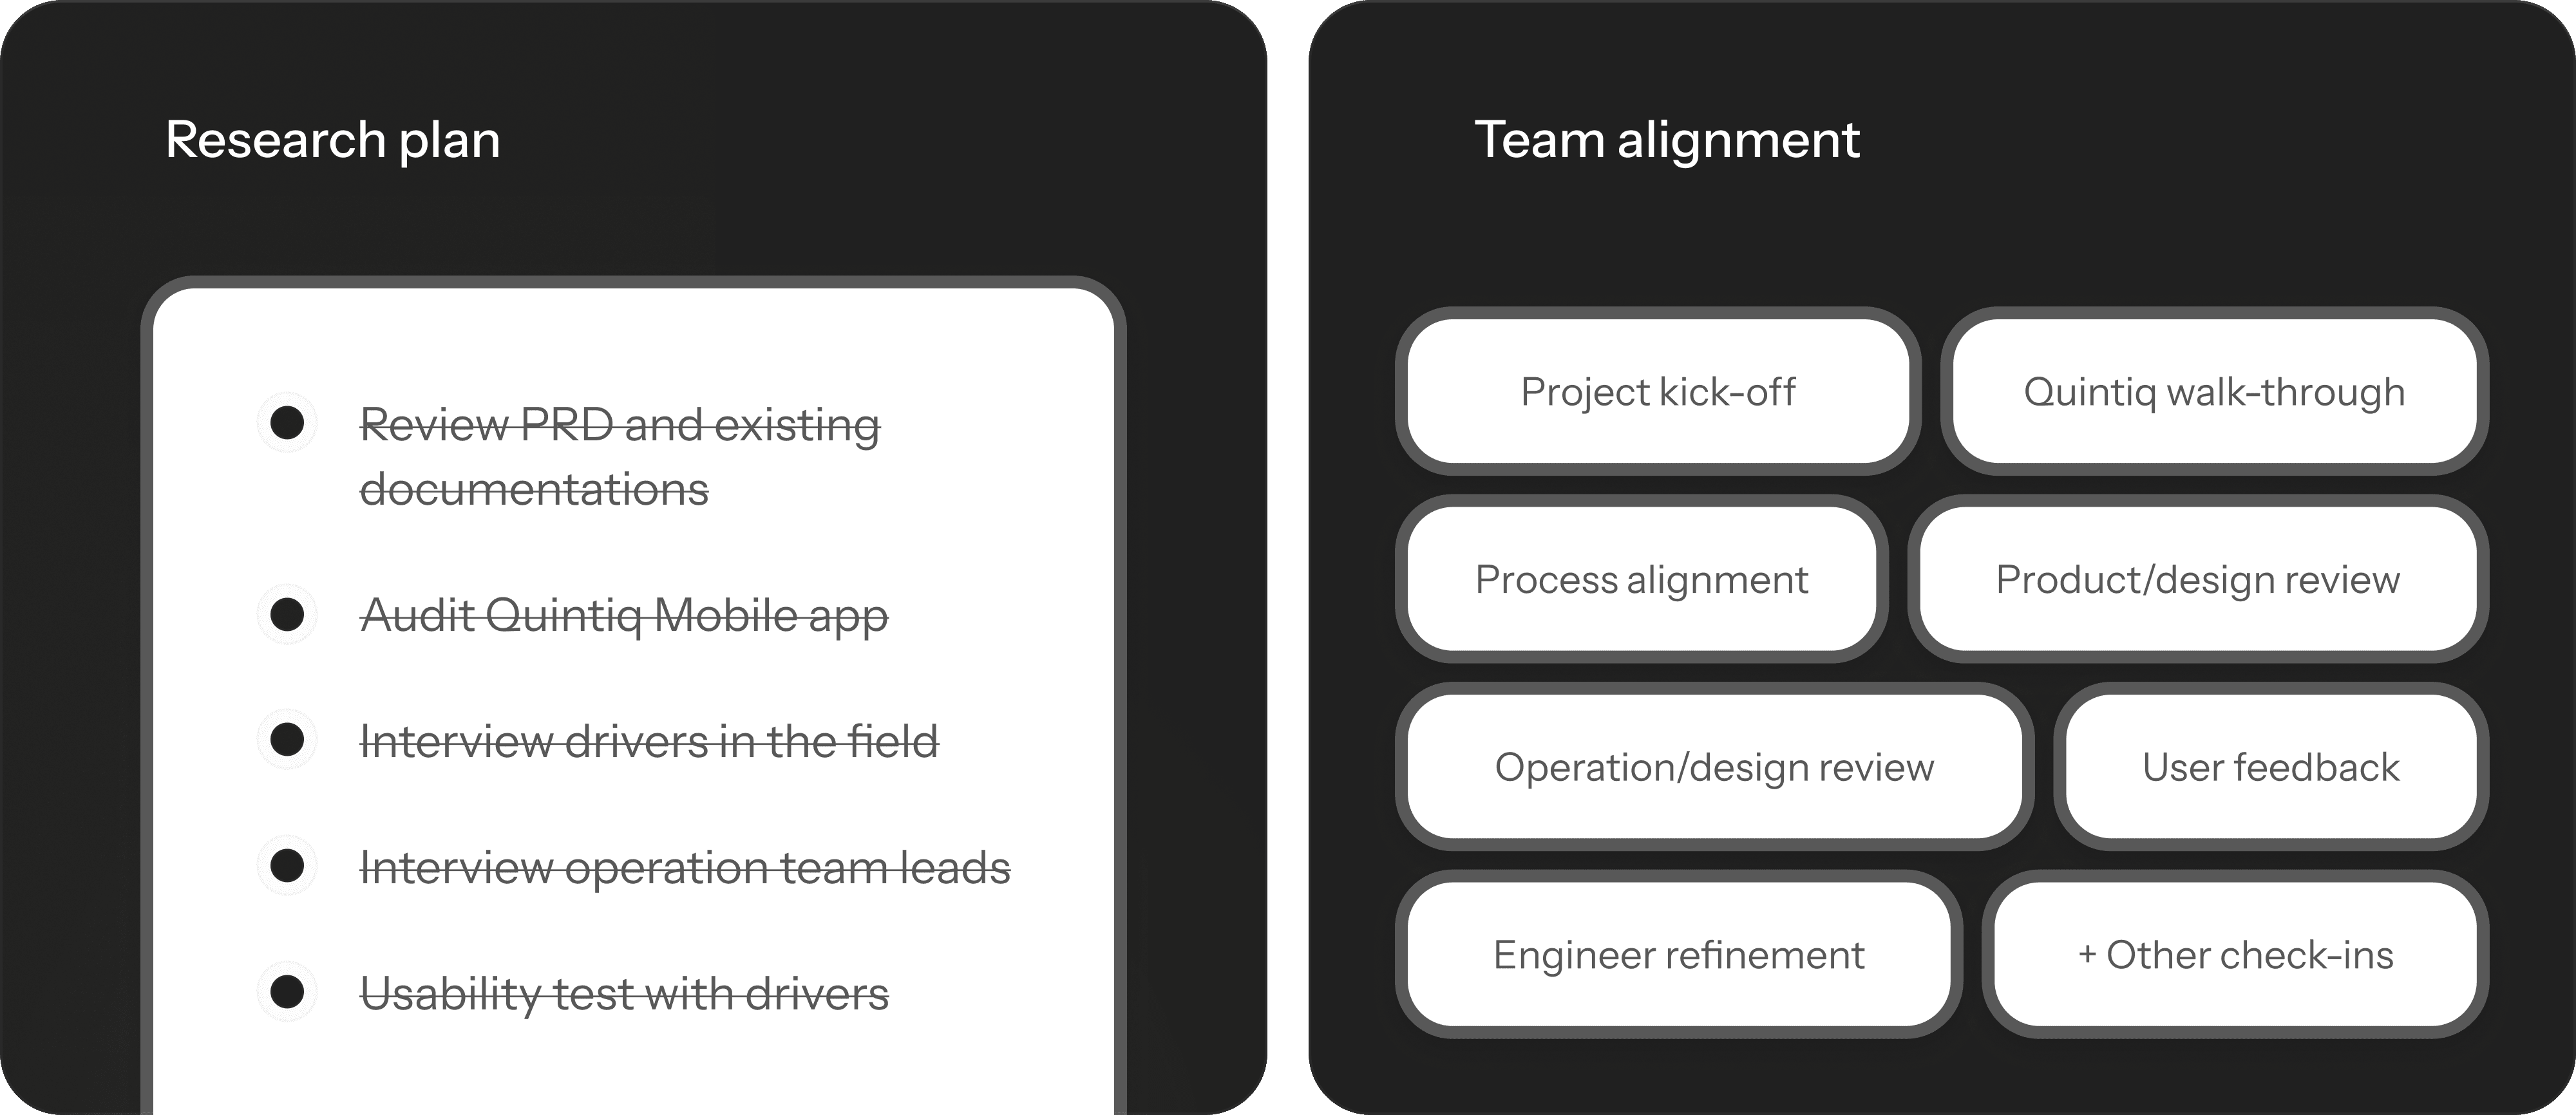
Understanding the app and drivers
I’d never worked on the driver side of logistics before, so I had to quickly learn how everything worked before I could start designing.
First, I audited Quintiq Mobile to see what was working and not. It didn’t take long to see the problem. The app was confusing and missing key features.
Then I went to the field and met the drivers. I watched how they worked and how they used the app in real conditions.
There were things I never would’ve seen in an audit.
Little workarounds. Unused features. Frustrations they didn’t even say out loud.
Audit results
Interview insights

Navigating without data
I wanted to do more research since we were building a completely new app, but Quintiq was a third-party tool, so we didn’t have any analytics to learn from.
Competitive research was also limited, since most similar tools were hidden behind paywalls.
Product team did conduct a survey long time ago. But a majority of the feedback was that “the app is bad” which is not helpful.
So I leaned into what I did have:
Field observations
Conversations with drivers and operation team
A willingness to ask “dumb” questions until things made sense
A brand new workflow
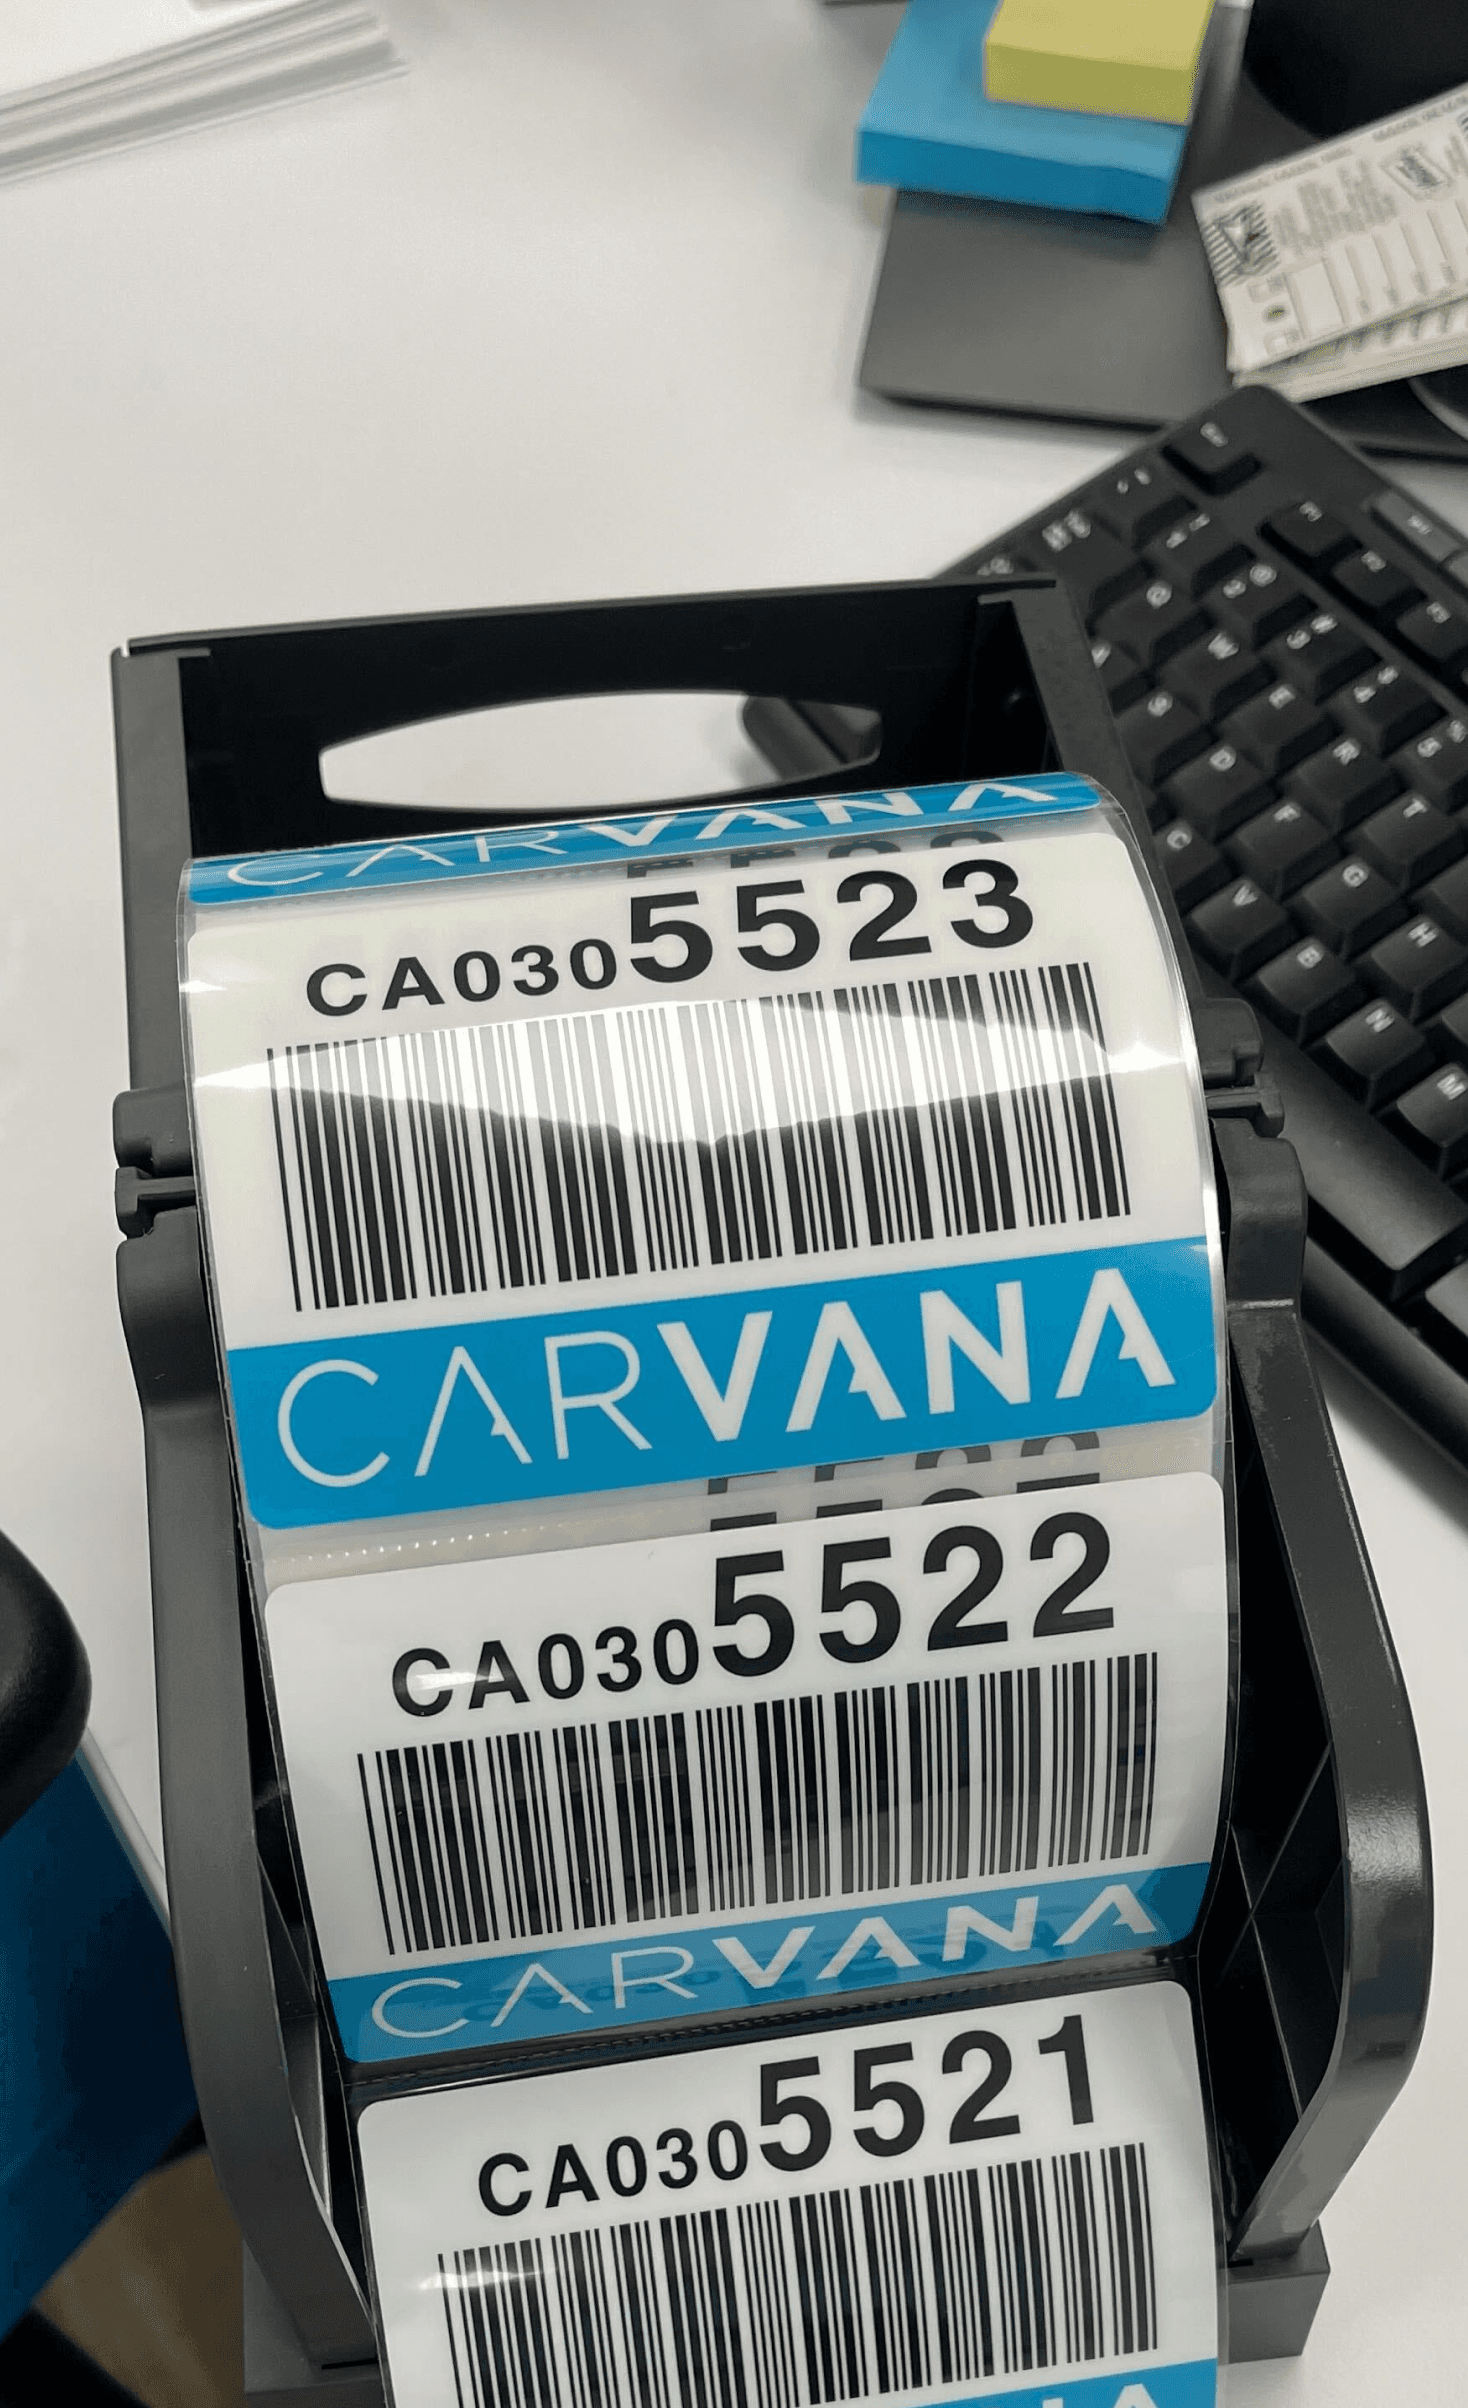
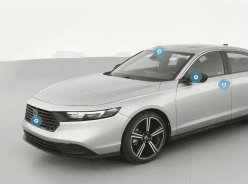
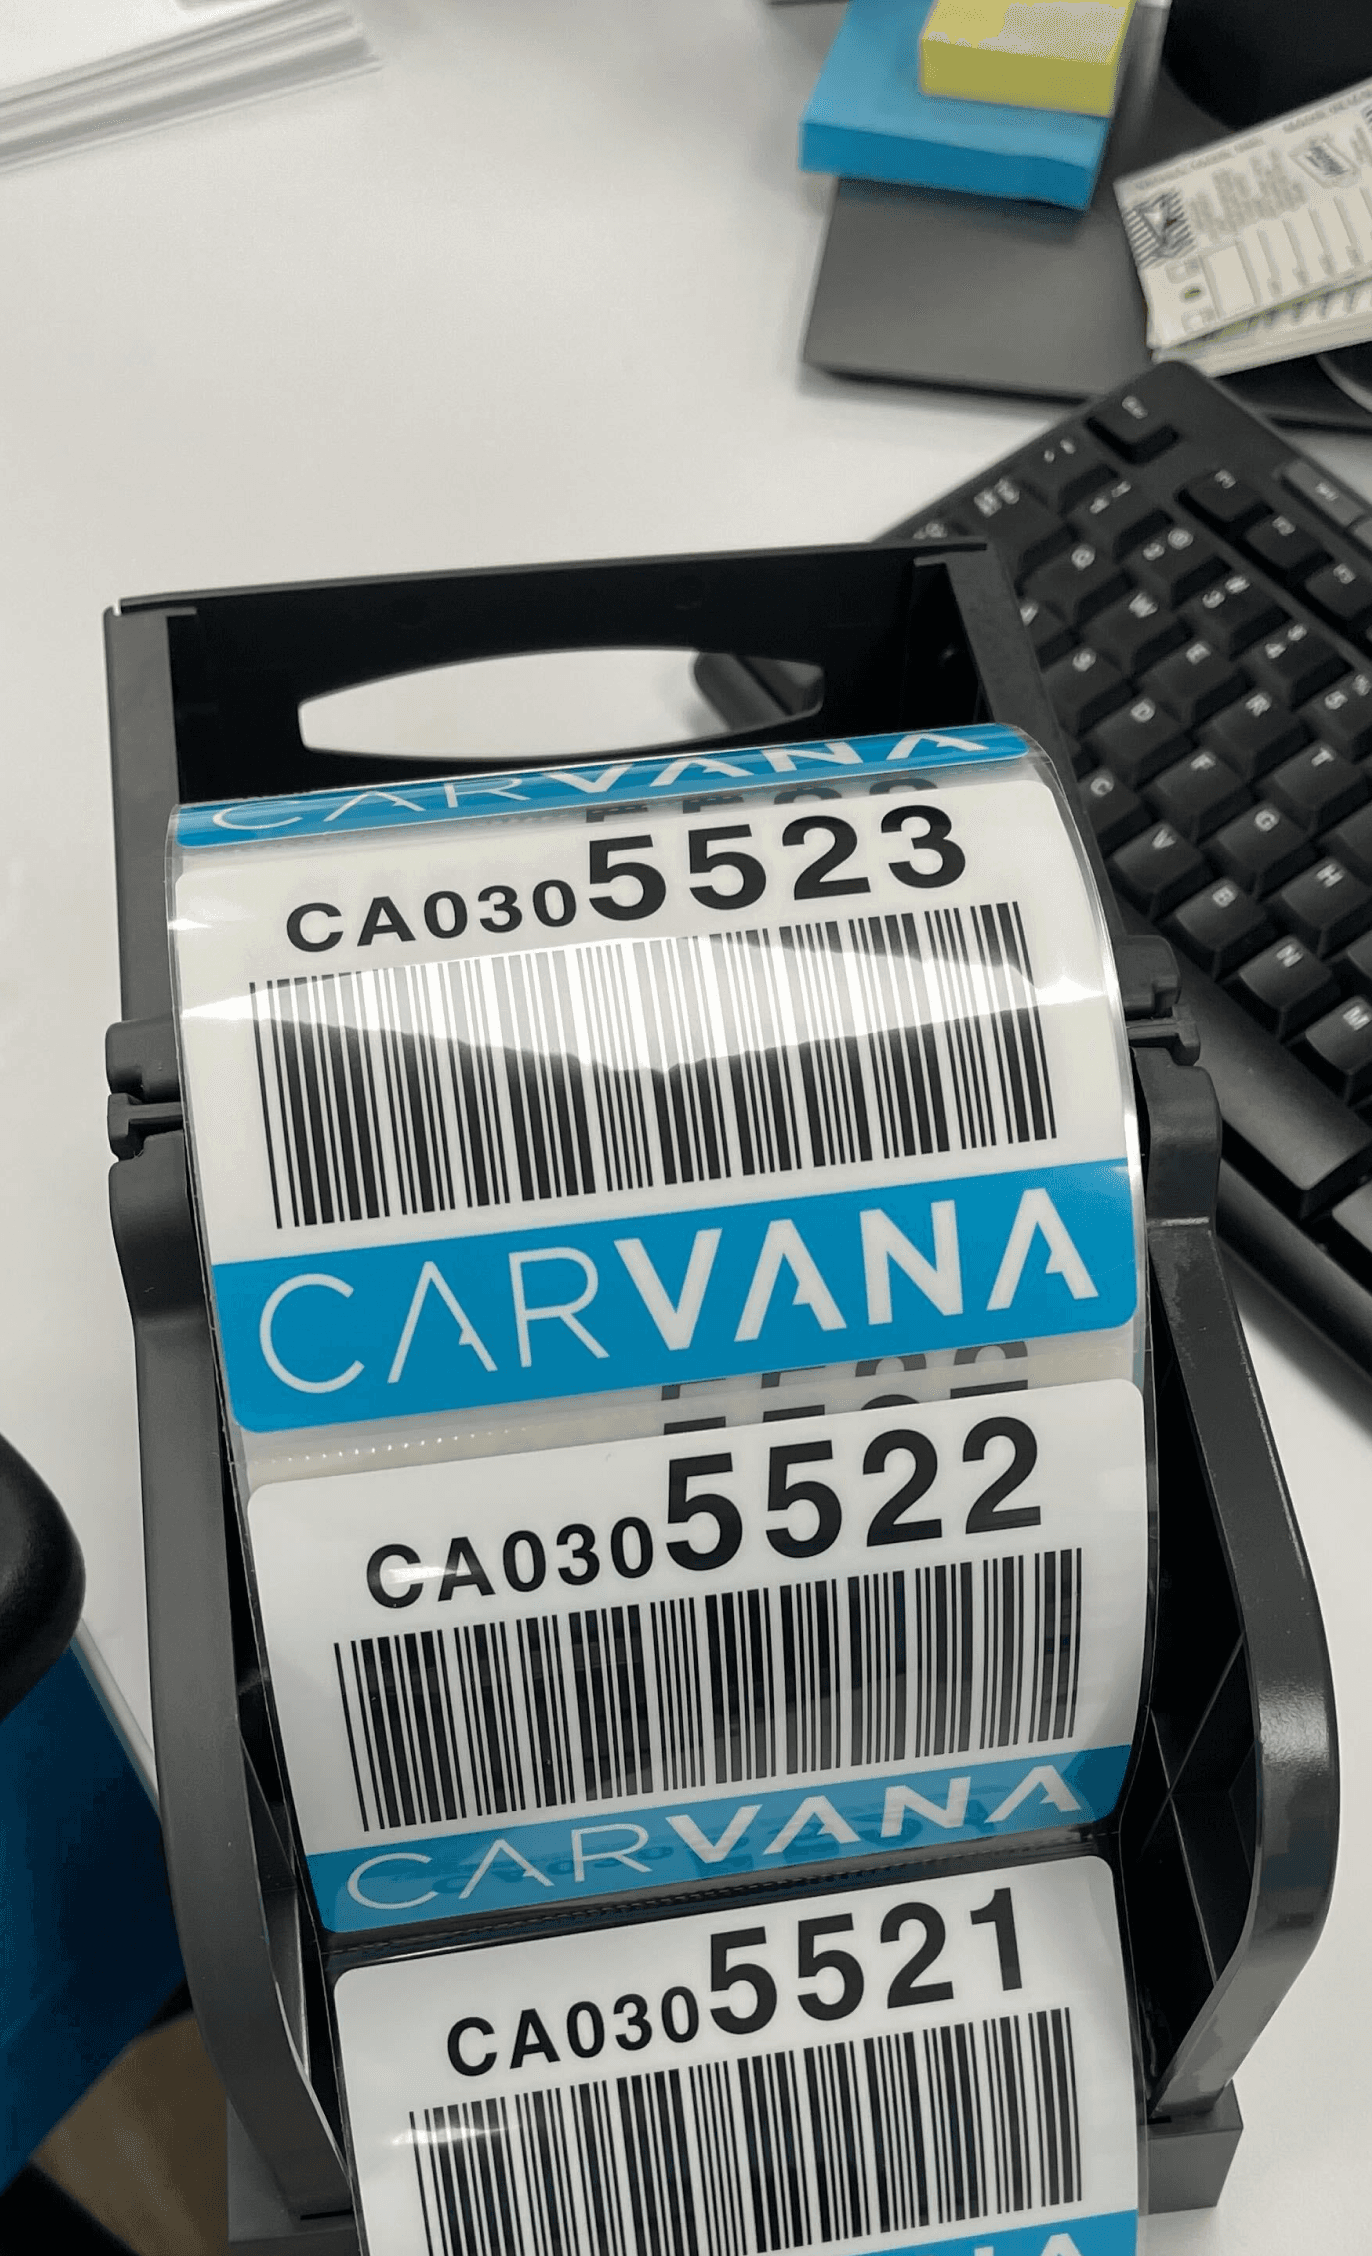
One big change in the new app is adding two features the business needed: scanning each vehicle to track it better, and checking for vehicle damages.
It made sense for the business but now drivers now have two extra steps. Which is not ideal because they’re paid by the mile—not the minute.
So I explored a couple different flows to find one that was efficient for the drivers but still covered everything the business needed.
Flow 1
Flow 2
Flow 3
Scan vehicle #1
Scan vehicle #2
Scan vehicle #n
Inspect vehicle #1
Inspect vehicle #2
Inspect vehicle #n
Damage?
Load vehicle
Load successful?
Damage?
Load vehicle
Load successful?
Damage?
Load vehicle
Load successful?
My thoughts on this flow
Makes drivers go through the vehicle lineup twice, which slows them down.
Using AI to speed up exploration
Since I was on a time crunch, I used our internal LLM to synthesize research findings and then V0 by Vercel to generate a couple different design directions based on the design prompt I wrote.
Most didn’t work — some were overly complicated, others didn’t fit the use case.
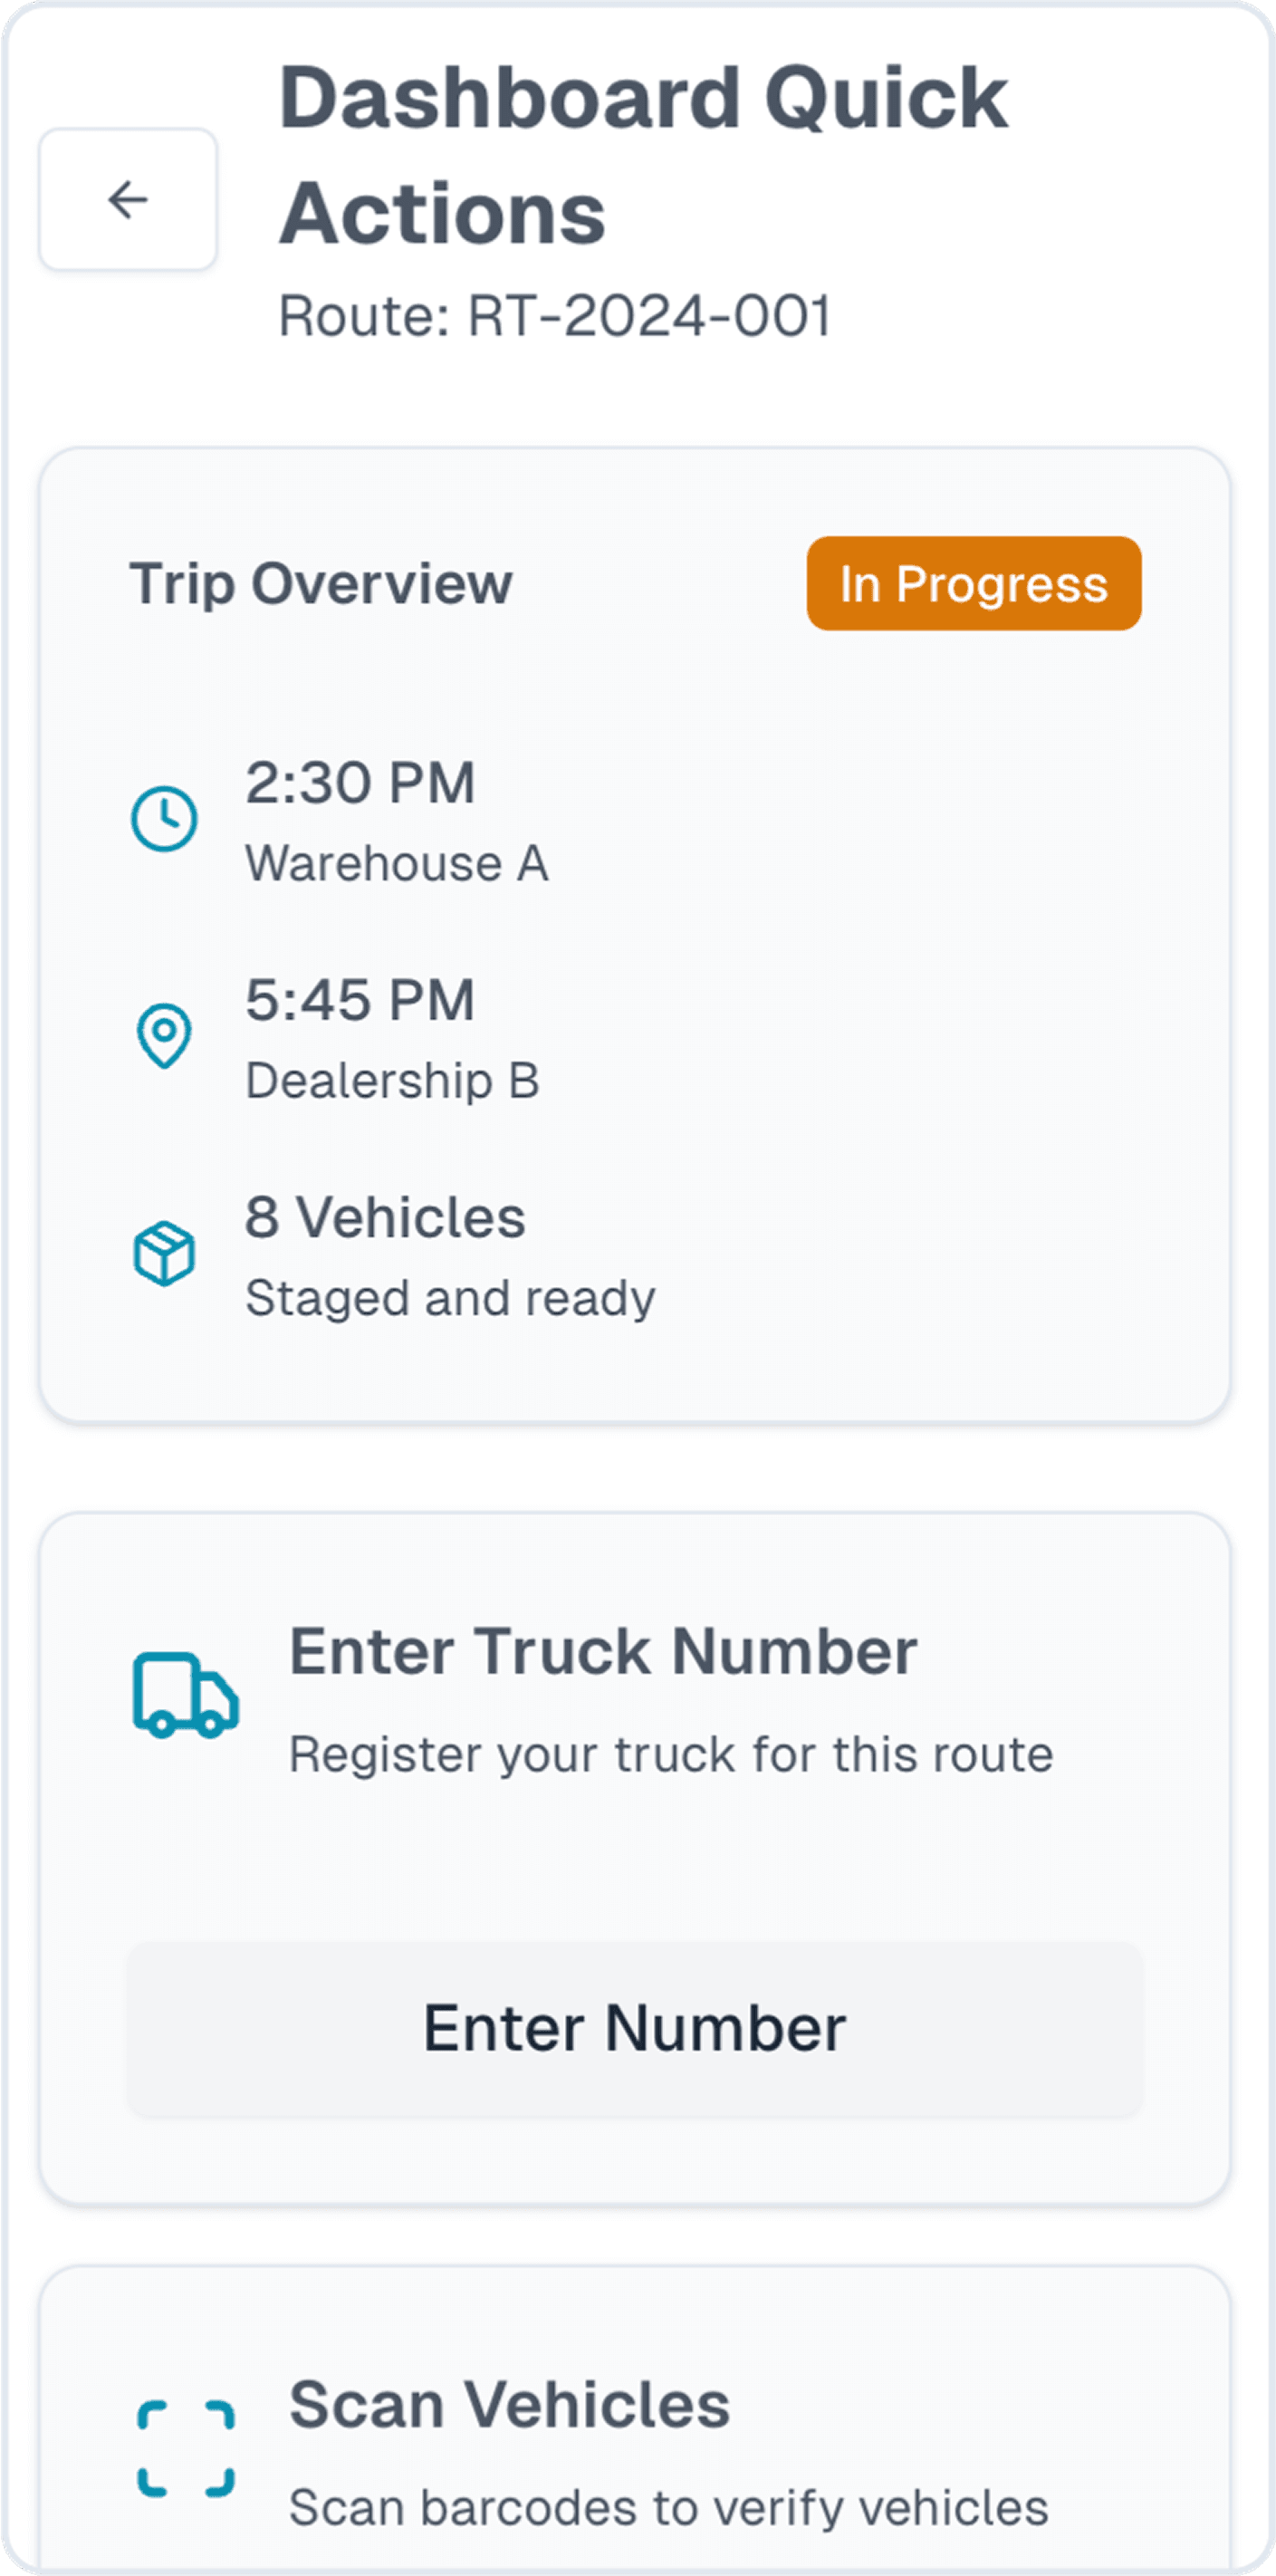
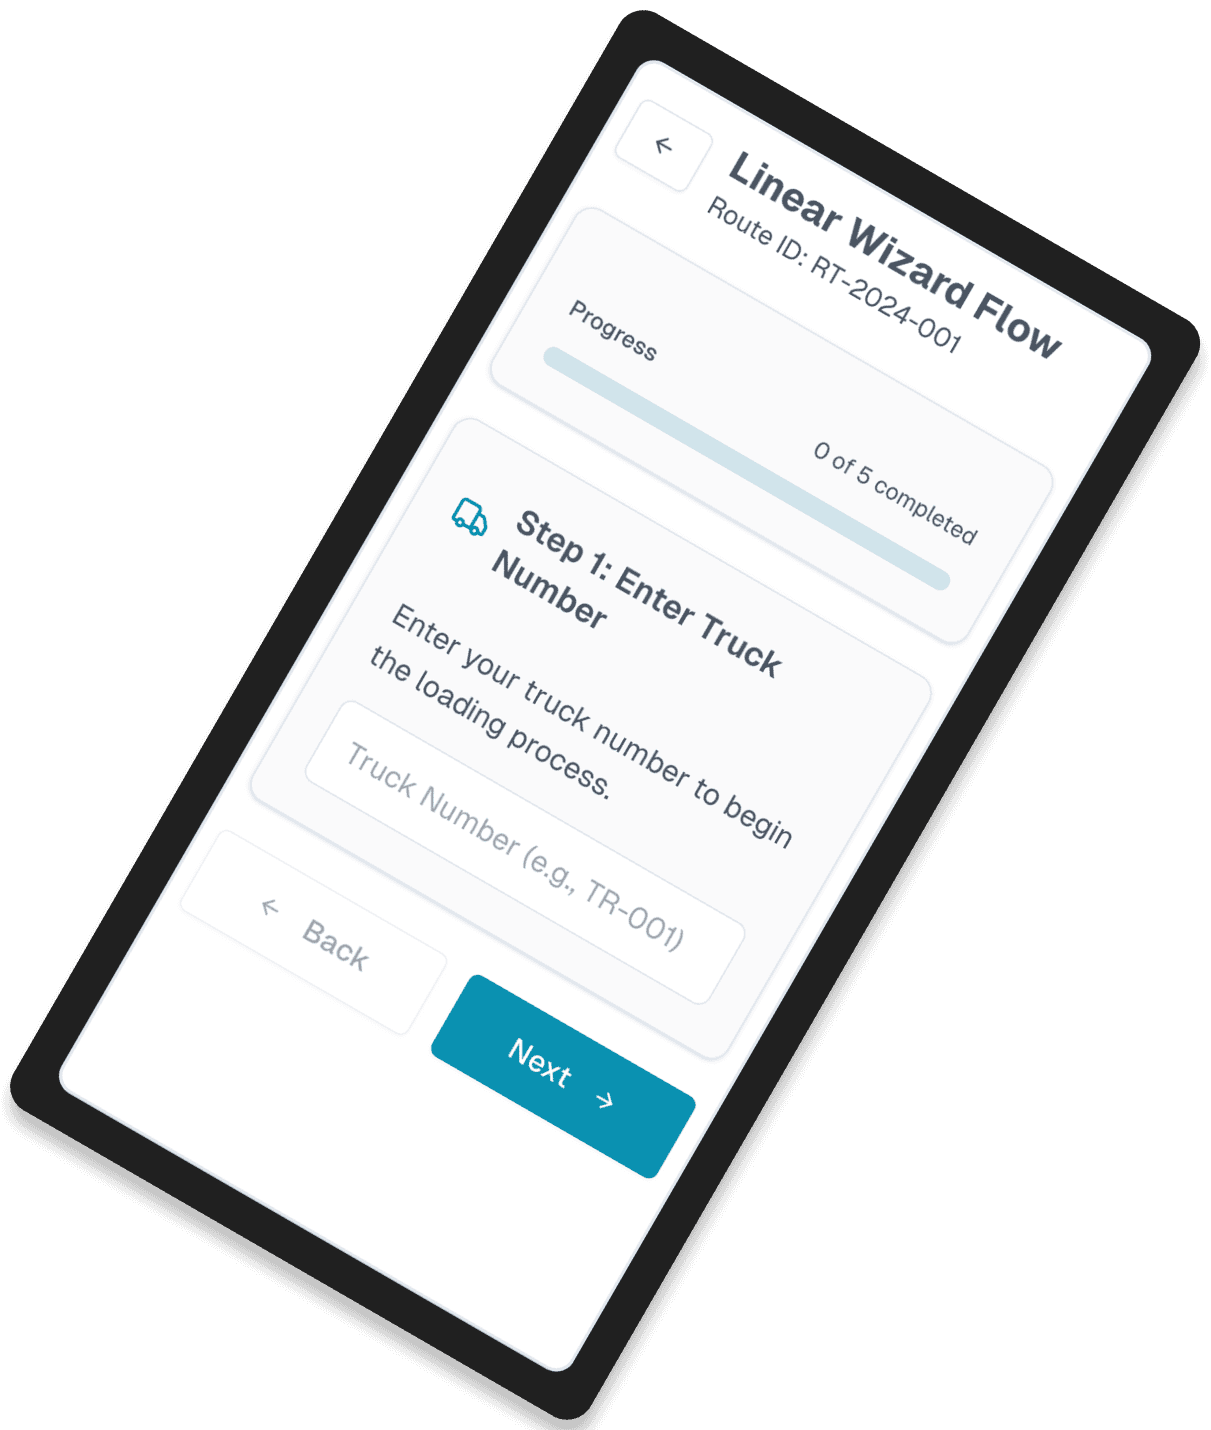
But one had potential. The dashboard layout. Why?
Clear steps in a linear and guided flow
Minimal steps and no unnecessary clicks and elements
Simple interface that works well in the field
Dashboard layout


Refining the direction and iterating designs
The AI only gave me a general direction. I had to refine the design so it actually worked for our needs.
I explored dozens of versions for each core screen and feature. The designs improved as I learned more from talking with stakeholders and drivers.
I continued to leverage AI to come up with pros and cons for each iteration so that I can make decisions more quickly.
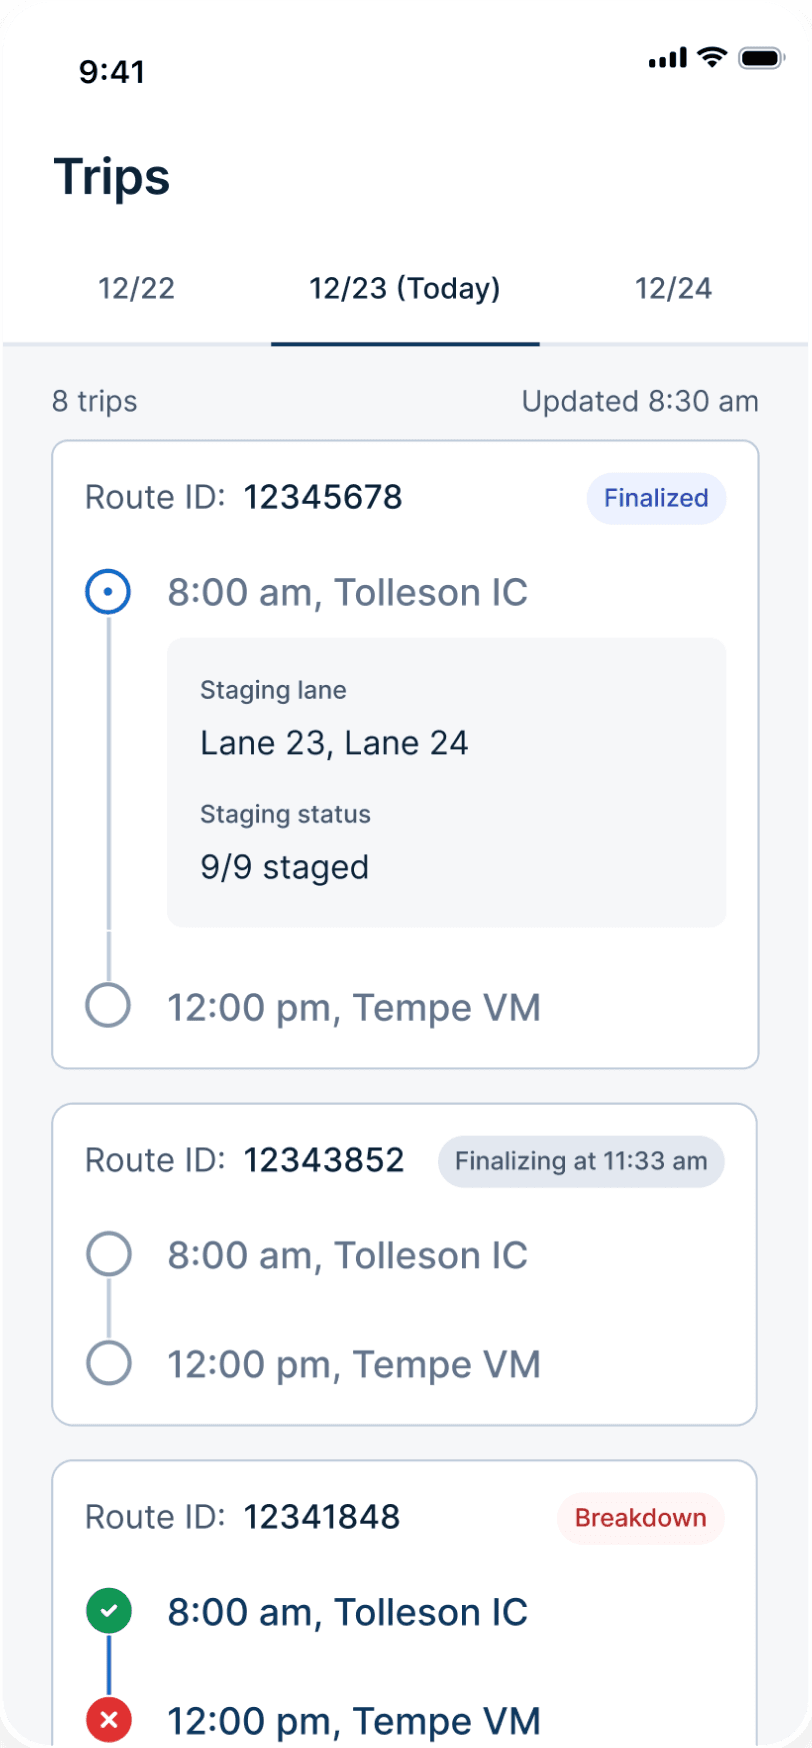
Trips
Trip details
Load vehicles
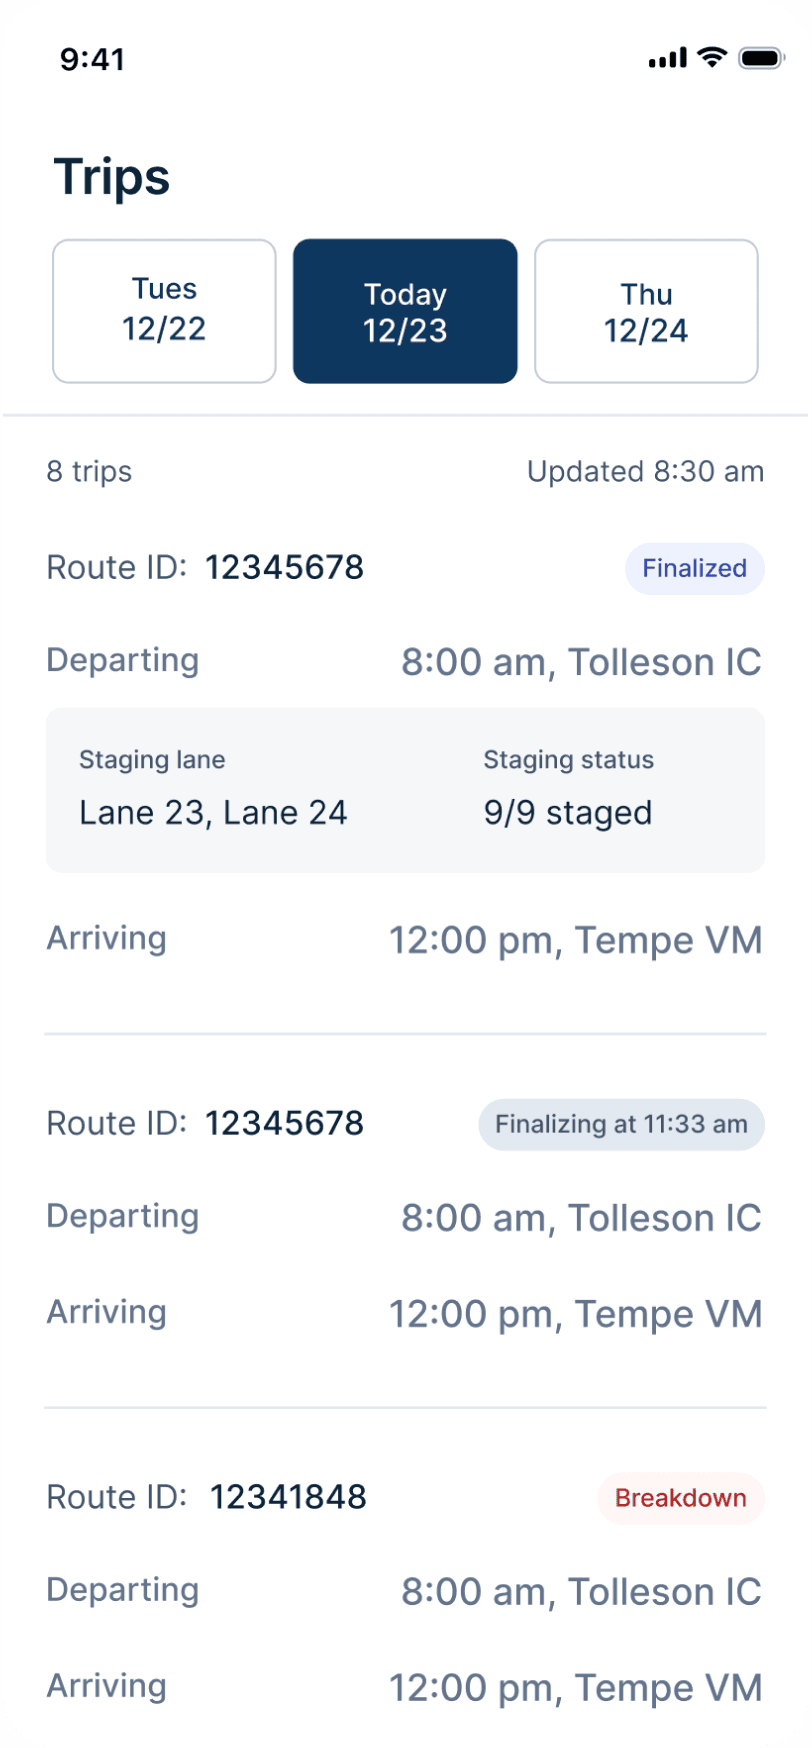


Final design
Version 1
Reason for choosing the winner
Clear info matters more than saving space in this case
Trade-offs and teamwork
I worked closely with the team to make sure the new workflow met all business needs and supported all trip types.
PMs helped define the new workflow
Operation team helped to spot edge cases for different trip types
Engineers gave early feedback on feasibility of features
Along the way, we faced plenty of trade-offs. Balancing user needs and business needs isn’t always easy because they can conflict.
My approach is to find a middle ground. If that’s not possible, I compare the pros and cons of each option and help the team choose the solution that makes the most sense overall.
Trade-off #1
Scan + inspect
Trade-off:
Keep scan and inspect tasks separate vs. combine them for efficiency
Final direction:
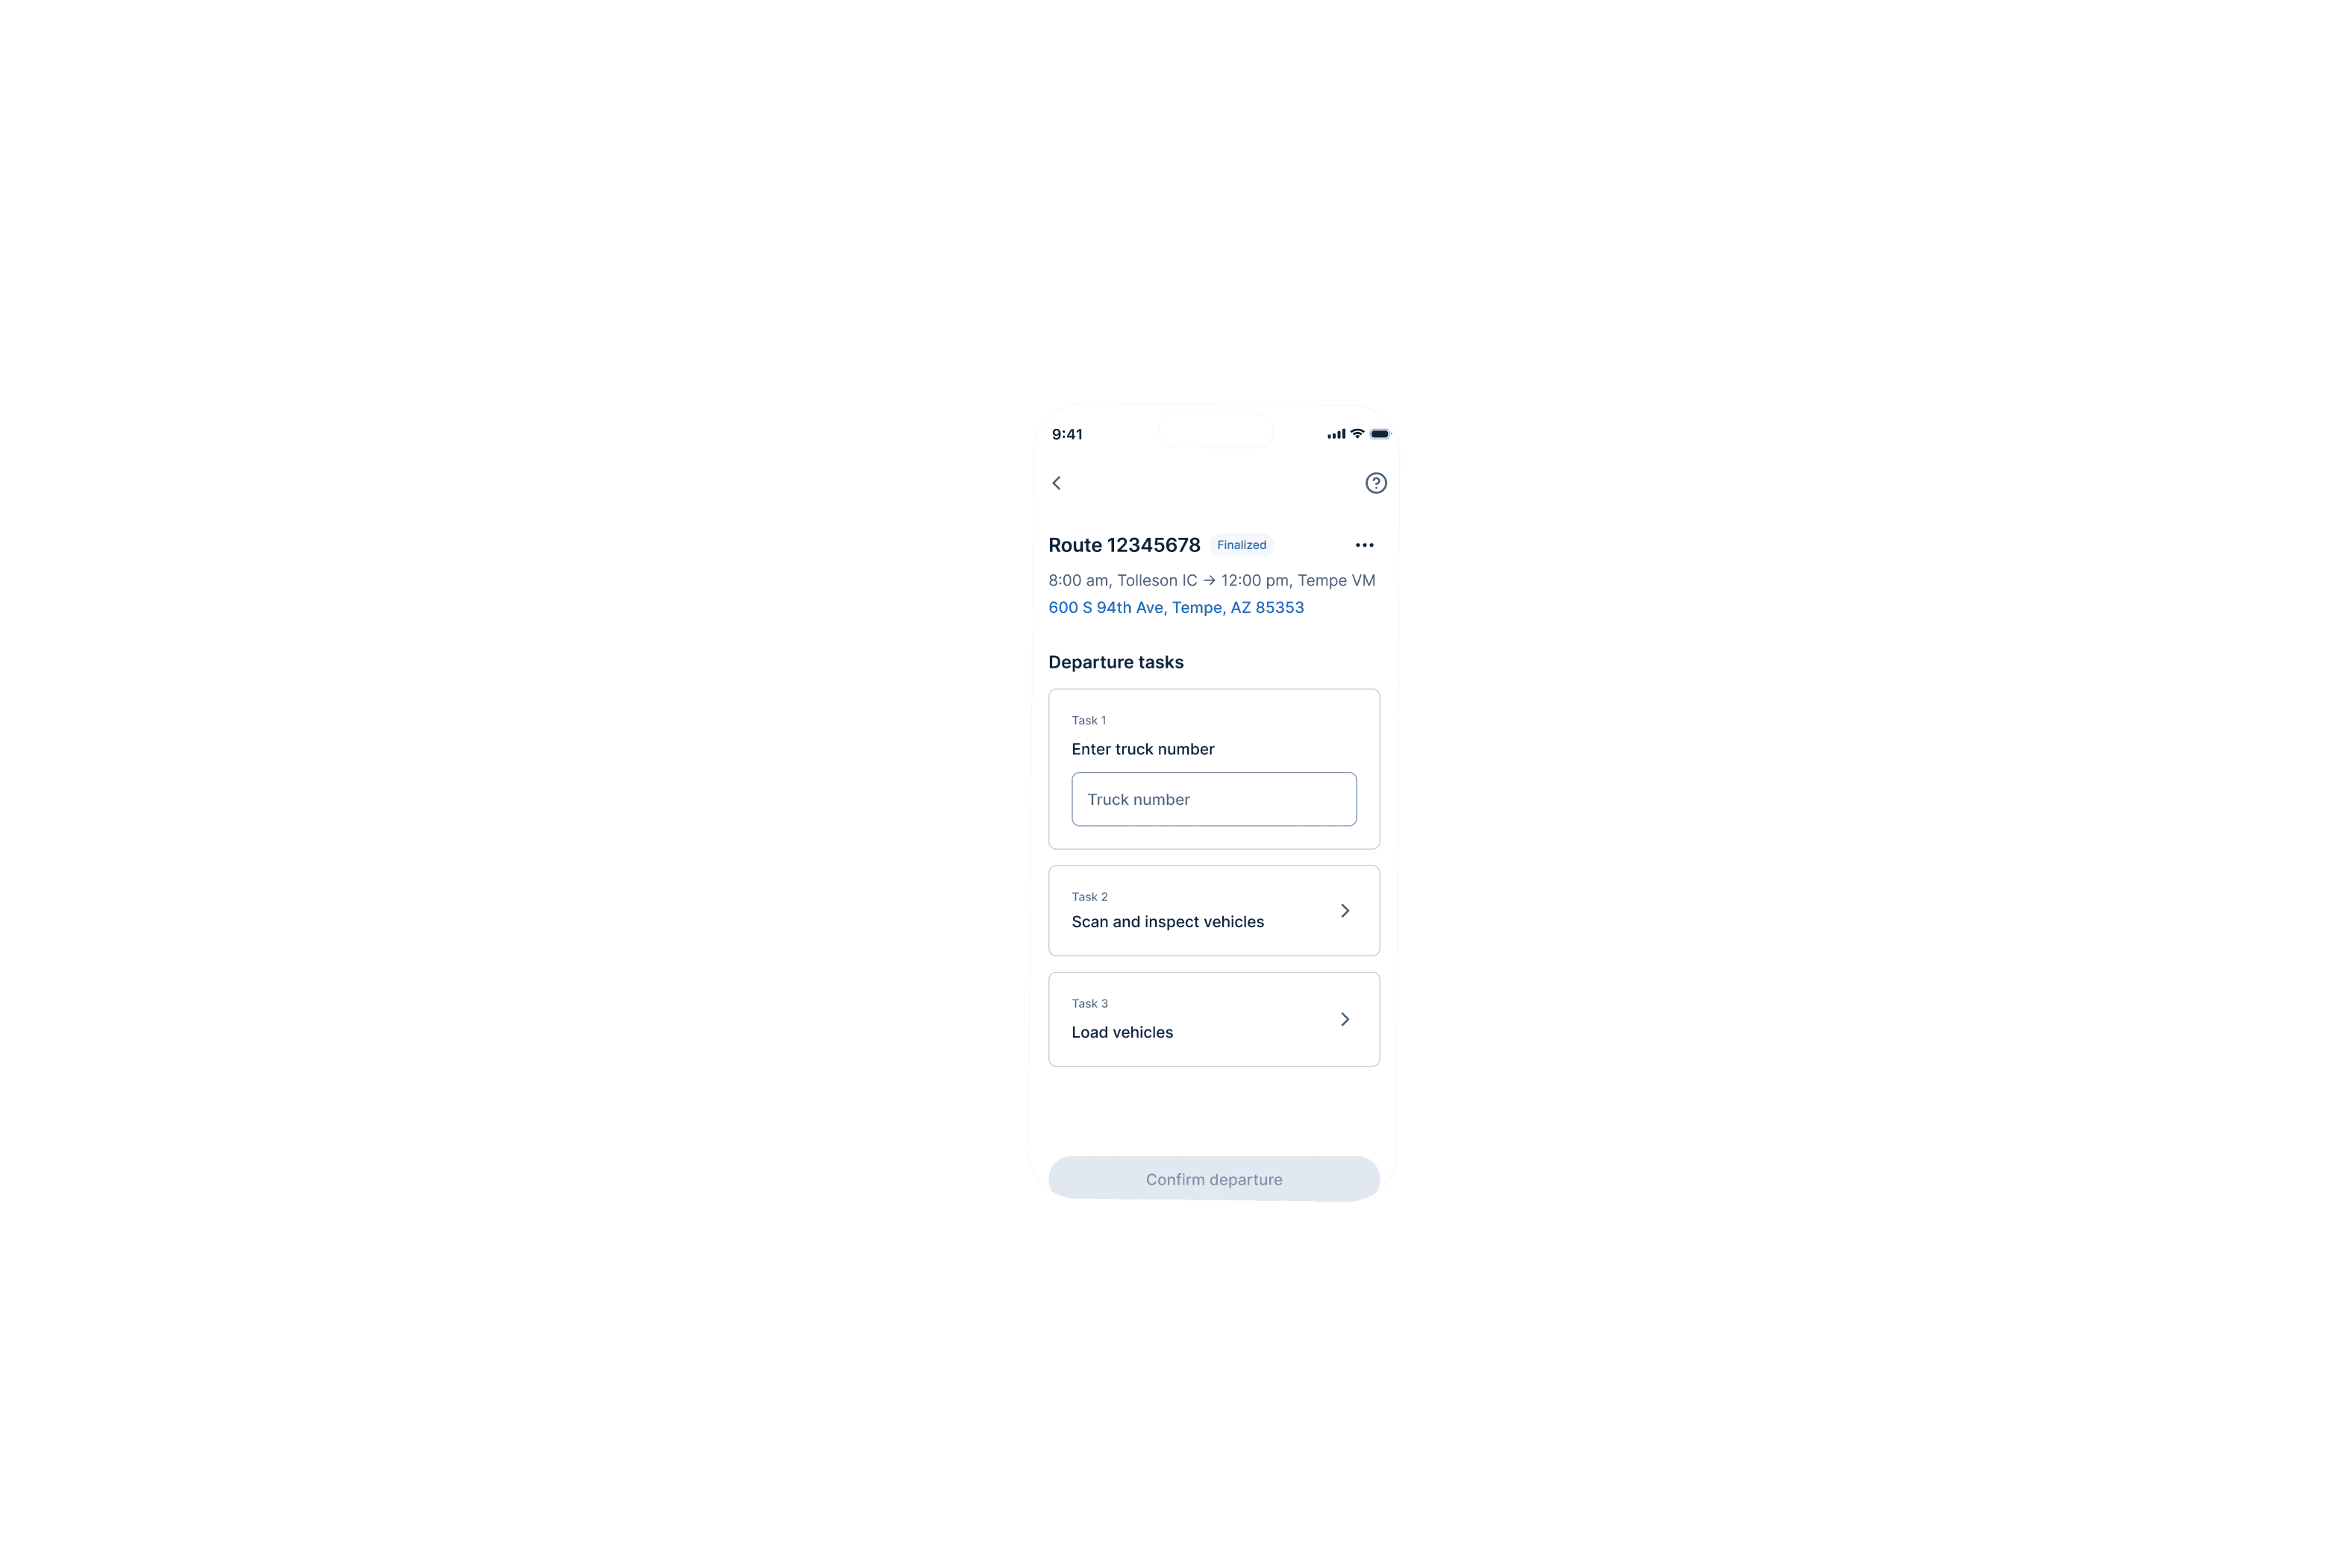
Product wanted two steps. But it didn’t make sense in practice. I decided to combine scan and inspect into one seamless flow to increase efficiency.
Separated tasks
Route 12345678
Finalized
8:00 am, Tolleson IC → 12:00 pm, Tempe VM
600 S 94th Ave, Tempe, AZ 85353
Departure tasks
Task 1
Enter truck number
Truck number
Task 2
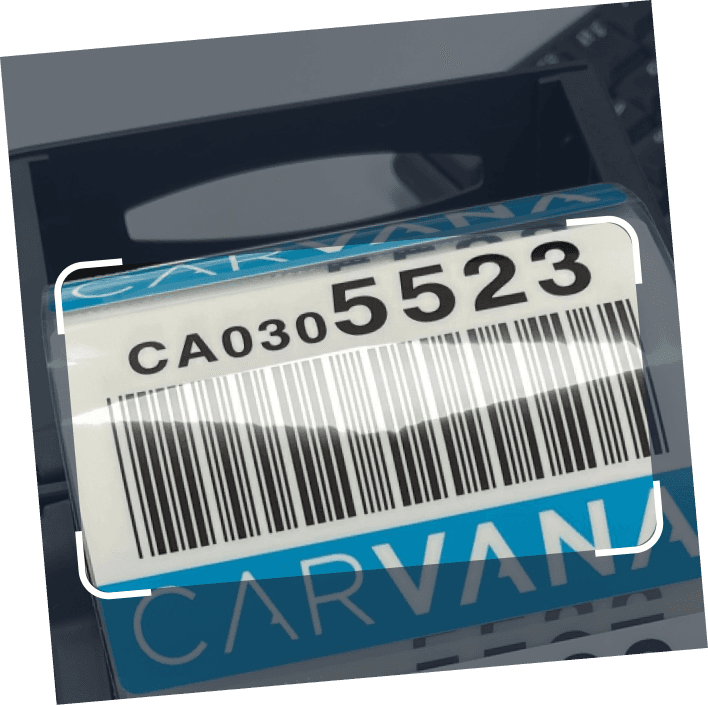
Scan vehicles
Task 3
Inspect vehicles
Task 4
Load vehicles
Confirm departure
Combined tasks
Scanned vehicles (1 of 9)

2023 Toyota Camry
White
CA325478
VIN
Does this vehicle have any damages?
Yes
No

2021 Ford Mustang
Does this vehicle have any damages?
Yes
No
Submit
Trade-off #2
Load vehicles
Trade-off:
Batch load for drivers’ speed vs. single load for operational accuracy
Final direction:
Drivers wanted to load multiple vehicles at once because that’s how they do it. But operations was concerned it would lead to mistakes in reporting damages.
Eventually I conceded since this friction protected the integrity of the damage data and the additional time should be negligible.
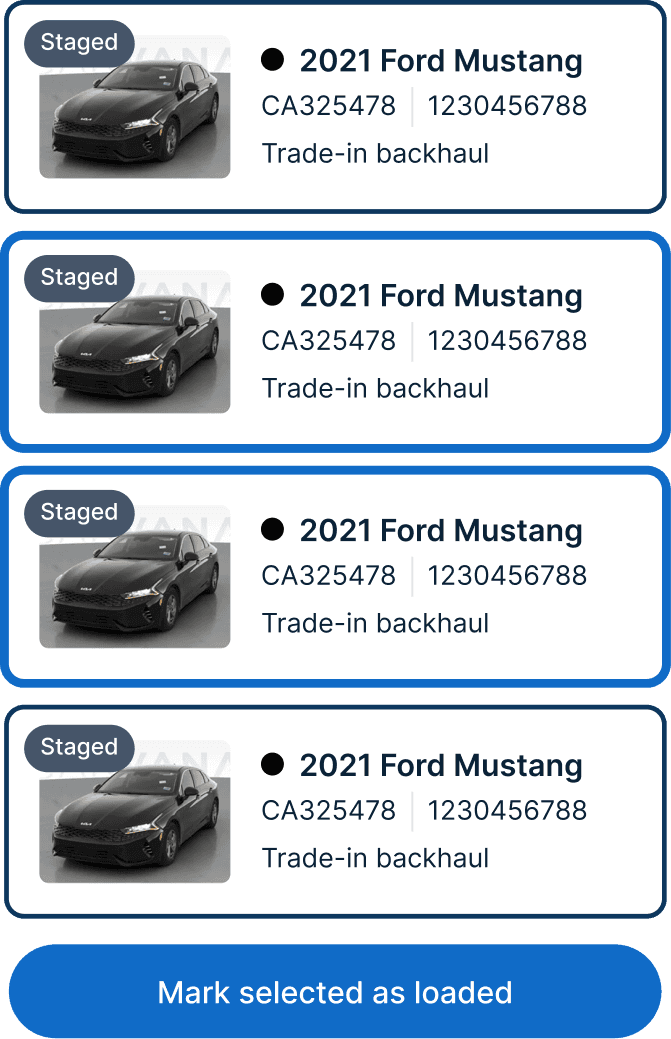
Batch load
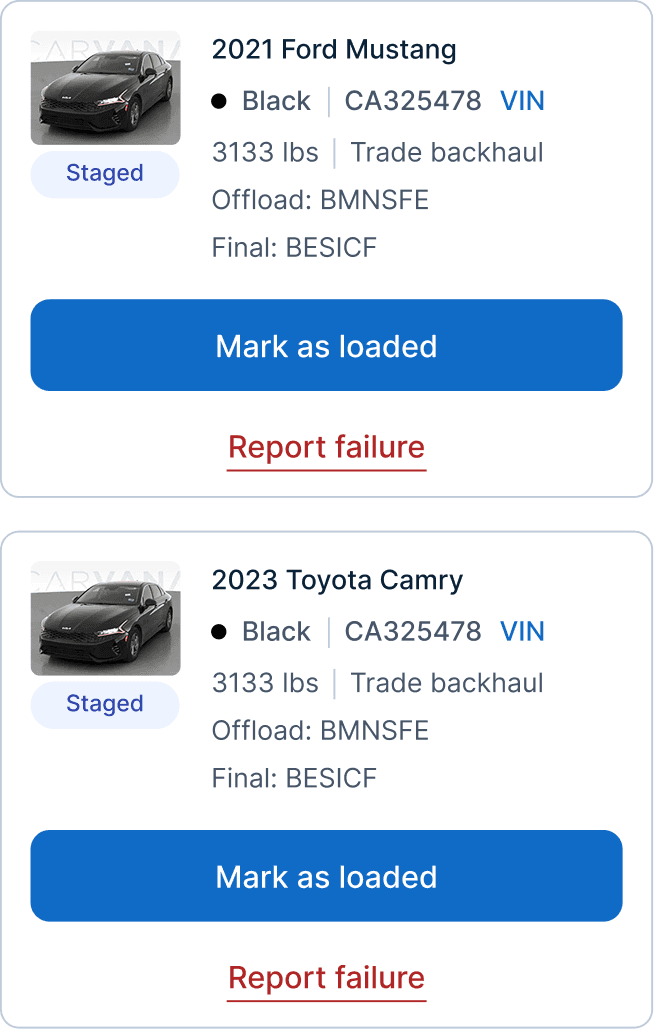
Single load
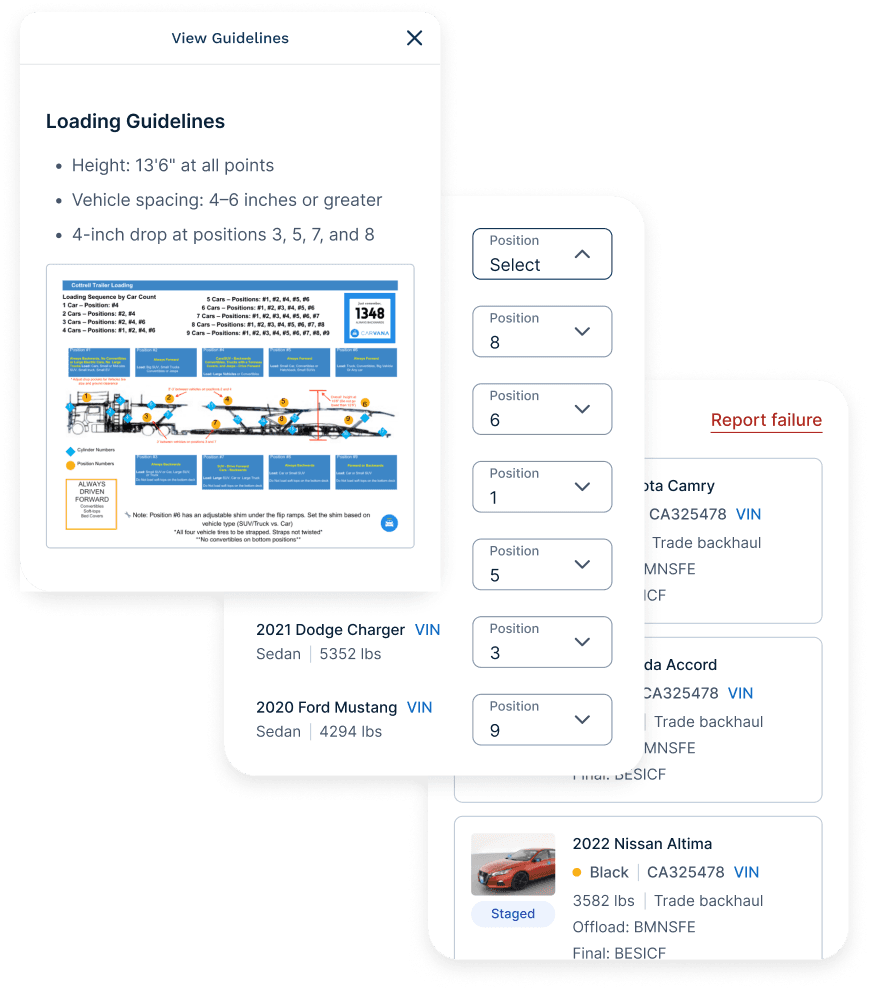
Final designs
This is where everything comes together. After exploring, testing, and refining, these are the final designs. The new Cargo Mobile app lets drivers complete trips with ease, accuracy and confidence.


Vehicles list
BOL
Tasks are as clear as 1, 2, 3—with only the info you need and extra help when you need it.
Scanned vehicles (5 of 9)
2021 Ford Mustang
Red
CA325478
VIN
Does this vehicle have any damages?
Yes
No

2023 Toyota Camry
White
CA325478
VIN
Does this vehicle have any damages?
Yes
No

2021 Chevrolet Camaro
Does this vehicle have any damages?
Yes
No
2023 Honda Accord
Does this vehicle have any damages?
Yes
No

2022 Nissan Altima
Does this vehicle have any damages?
Yes
No

2021 Tesla Model S
Does this vehicle have any damages?
Yes
No

2021 Subaru WRX
Does this vehicle have any damages?
Yes
No

2021 Dodge Charger
Does this vehicle have any damages?
Yes
No
Continue
Scanned vehicles (1 of 9)
2021 Ford Mustang
Red
CA325478
VIN
Does this vehicle have any damages?
Yes
No
Report Damage
Where’s the damage?
Select all that apply
Roof
Bumper
Side panels
Glass
Upload at least 1 photo

Add
Sideview mirrors
Other
Submit
Cancel
Scan and inspect one by one or in batches. Whatever works best for the driver.
Support when they need it, from reviewing loads to loading vehicles
What success looked like for us
The product brief listed a dozen metrics that I used as a guide while designing.
Even though the app is still in development, the team plans to measure success by tracking metrics such as:
On-time departures and arrivals
Clear departure and arrival signals
Trip damage rates
And even if we don’t hit every metric, owning the product gives us more flexibility and lowers our costs in the long run.
Which is a huuuuuge win for the team and the company.
On-time departures & arrivals
Trip damage rate
Explicit departure/arrival signals
What I learned
This project taught me how to:
Lead a product through messy and undefined conditions
Build empathy by watching real users work and reading between the fine lines
Use AI to explore faster but not replace my own thinking
Most of all, it reminded me:
Design is all about having good communication and judgement to make the right trade-offs.

