


New app to fix a broken workflow for 600+ truck drivers
Carvana relied on a third-party app rated 2.4 out of 5 — the lowest-rated tool at the company — to manage 600+ vehicle transporters moving cars across the country. The app crashed often, was hard to use and captured no chain of custody data. The business also lost several million dollars per year in lost inventory. I designed Carvana's first internal driver app from scratch in 2 months. It improved on-time departures by 26.8%, lifted explicit signal capture from 80% to 97.4%, and cut unplanned transport by 27%.
💡Highlights
- Used AI in three distinct stages: ChatGPT for brief review, v0 for visual ideation, Claude Code for a working prototype with design tokens and edge cases
- Designed one workflow that scales across 6 different trip types
- Designed across 3 interconnected systems: MOMS, Cruise Control, and CARMA
📈Impact
- On-time departures and arrivals: +26.8%
- Explicit signals captured: 80% → 97.4%
- Unplanned transport: -27%
- Saved ~$2 million per year
Final solution
MY DESIGN PROCESS
Scoping the MVP so the team could build it in time
At kickoff, I worked with product and operations to align on what problems we were solving and what success looked like. The team had many issues they wanted to fix, but we were already months behind schedule. To help the team stay focused, I asked them to define a clear MVP.

MVP phase
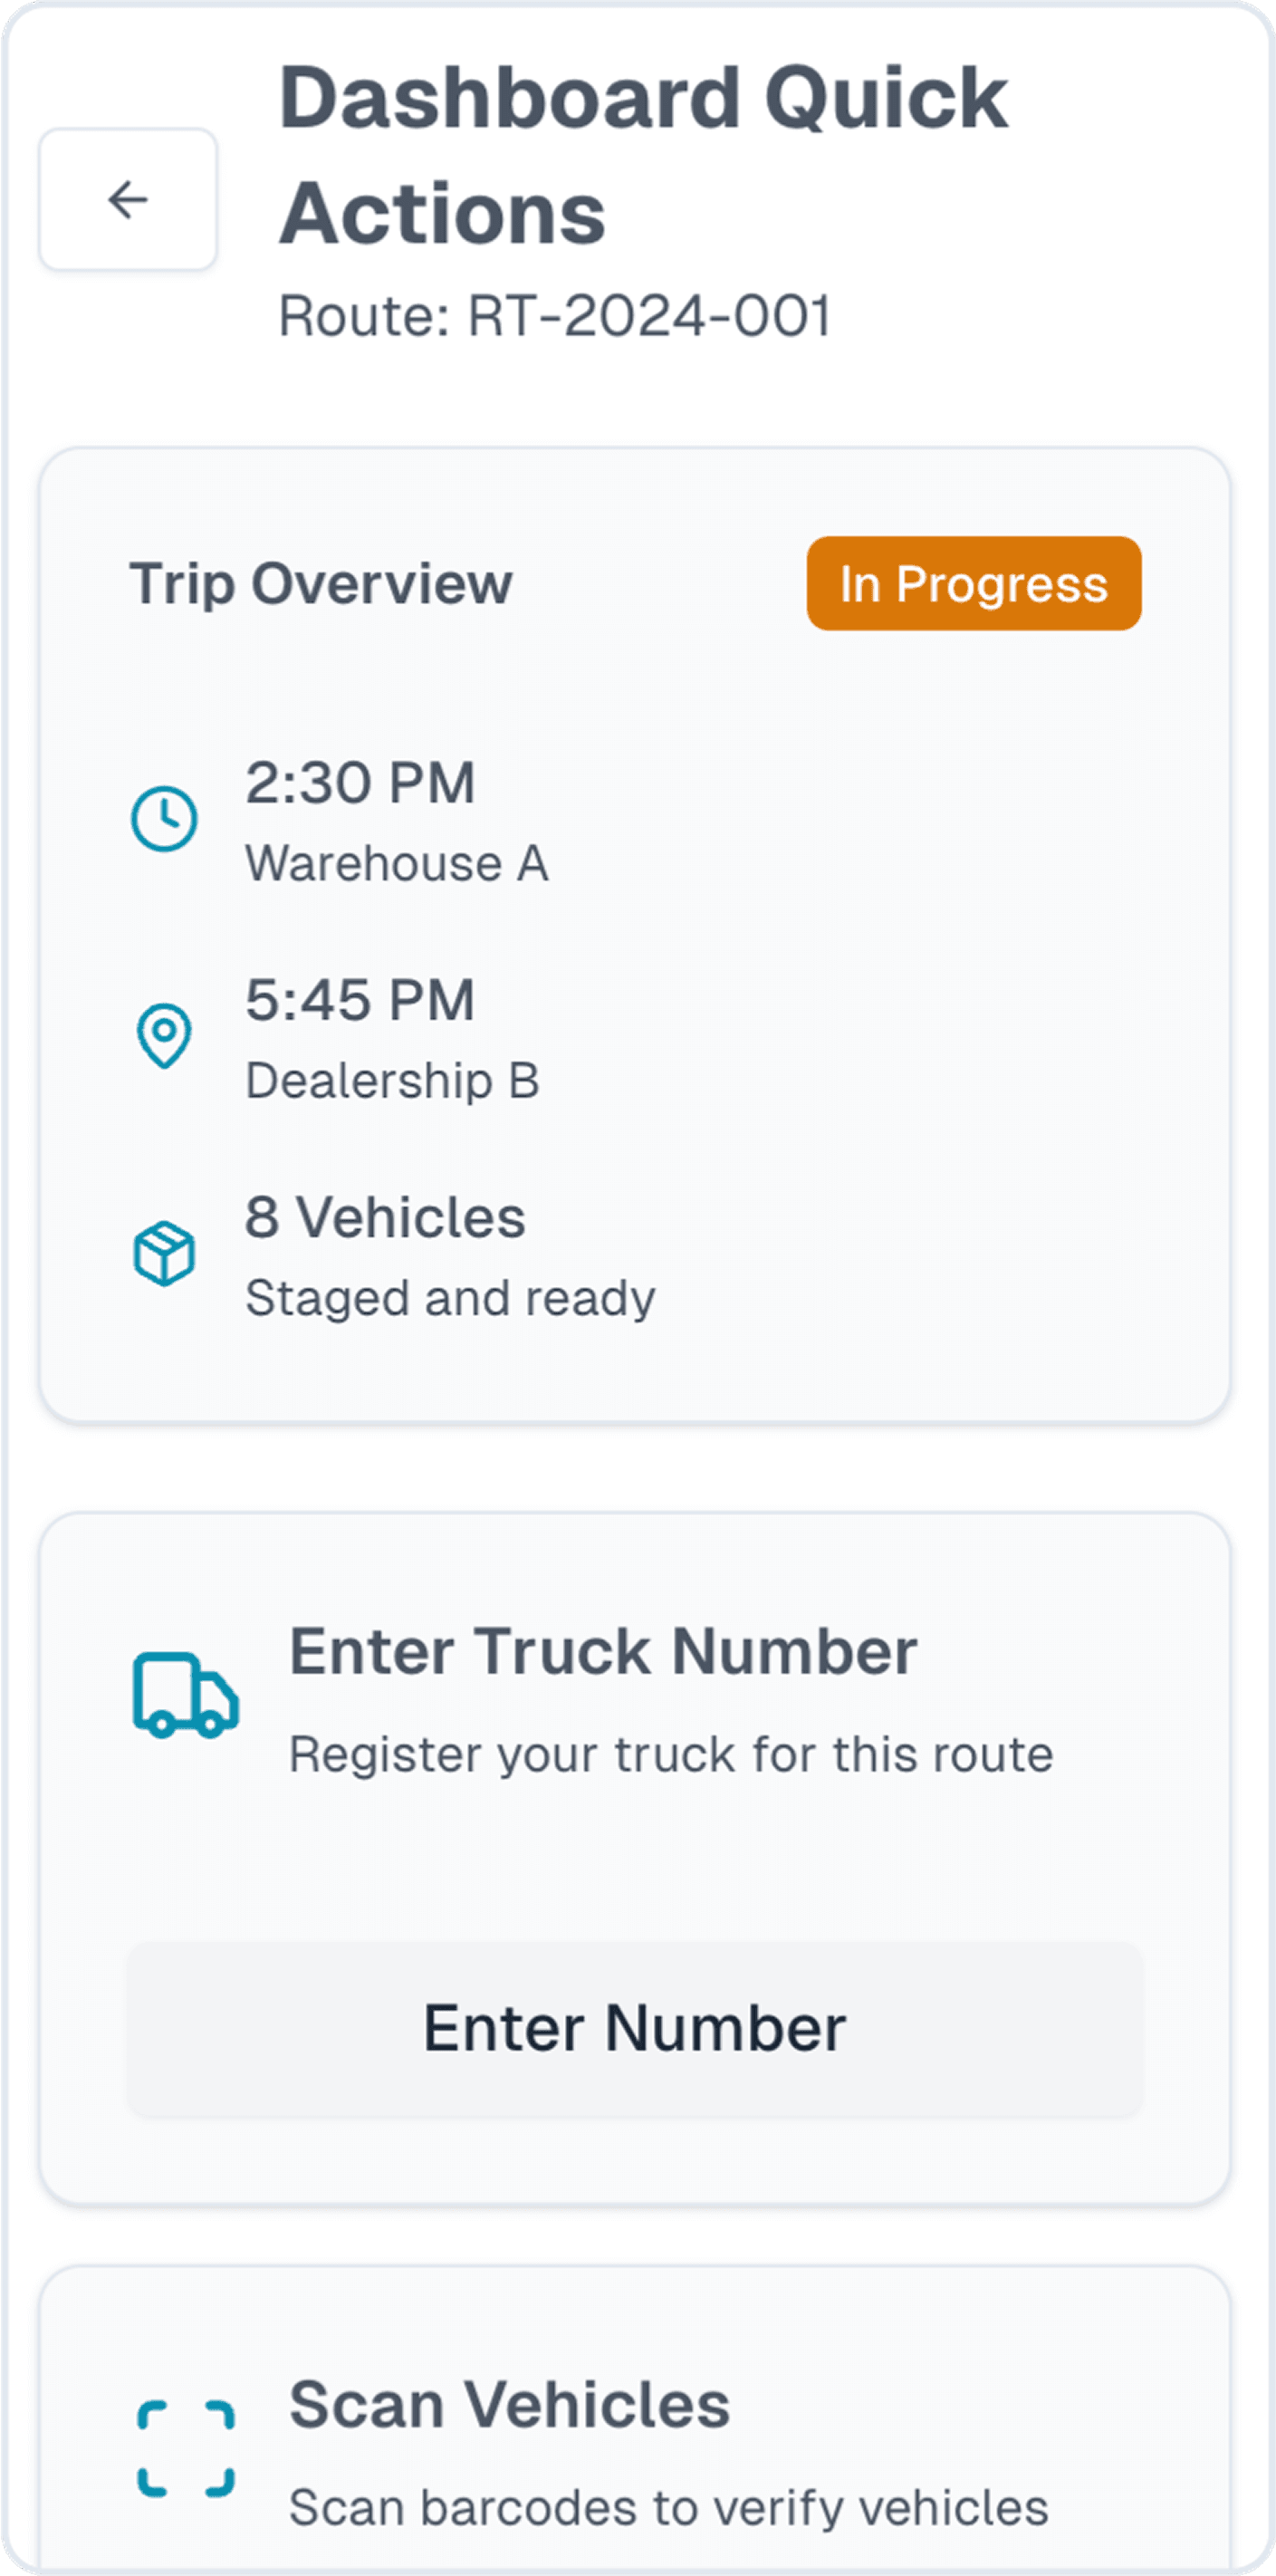
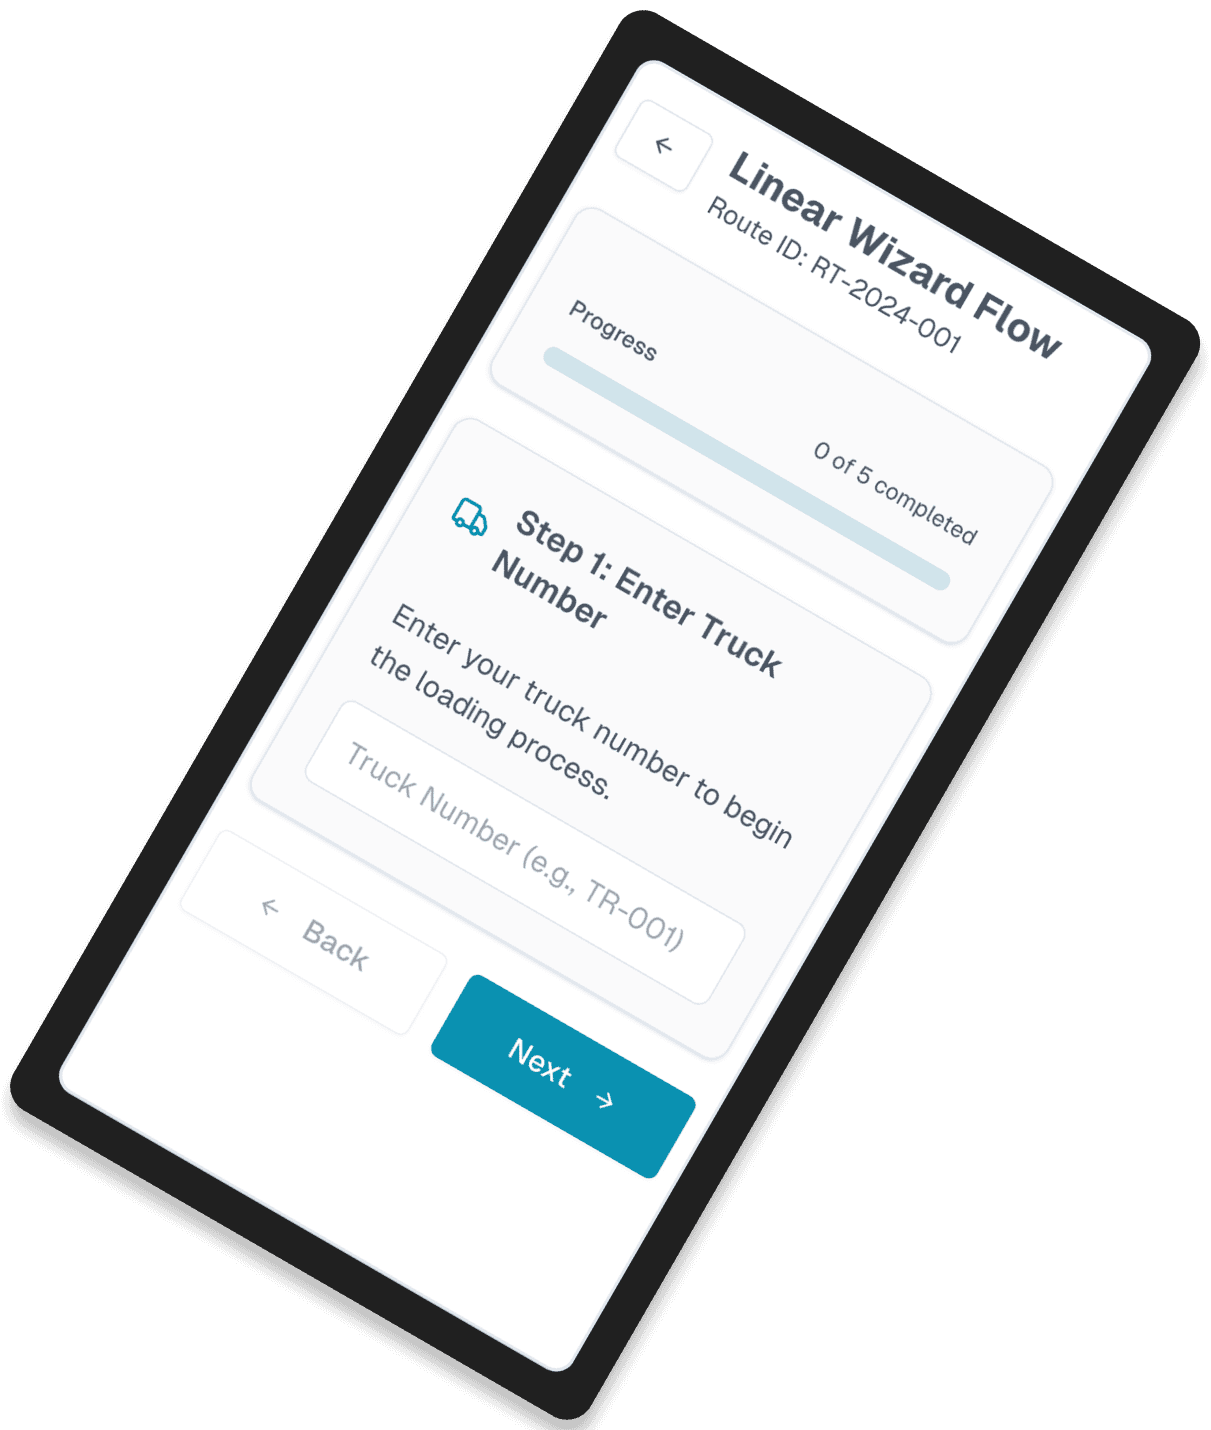
Trip execution information & vehicle accountability tasks
Future phases
Operational optimization
Mapping the system constraints that would shape every design decision
Cargo Mobile sits between the Transportation Management System (TMS) and downstream teams.
Upstream, the system plans trips and sends data into the app. This limited what information we could show drivers.
Cargo Mobile then captures execution data in the field. This includes vehicle scans, departure and arrival confirmations, and damage reports. That data flows to planning and repair teams so they can adjust schedules and prepare for repairs.
I worked closely with product and engineering to map these inputs and outputs. This ensured drivers had the information they needed to complete trips, while downstream teams received reliable data to do their jobs.
I designed one flow that can scale for 6 trip types
The logistics system supports six different trip types. Each one has different tasks and information needs.
I gathered requirements and edge cases for each trip type so the new workflow could support all of them. These included standard trips, round trips, swaps, donuts, and multi-city trips with three or four destinations.
By understanding this upfront, I was able to design one flow that could scale across different trips and support edge cases.
I went to the field and found the insights that became the north star of the designs
To design an app that actually worked for our drivers, I needed to understand how they move through trips day to day.
I went out to the field and talked with drivers and learned how they work in real conditions. A few interesting insights came out of it:
Drivers are paid by the miles driven, not for completing tasks
Many are not tech-savvy
They work outdoors, often with gloves and glare
Loading vehicles was the hardest part of the job, especially for new drivers
The most important insight was that drivers are only paid for miles driven. And so adding two new tasks meant taking more of their unpaid time. This pushed me to design a fast, efficient workflow while still capturing the data the business needed.
I also identified a gap in the original product brief around vehicle loading. Drivers receive limited training, yet loading is one of the highest-risk parts of the job. I pushed to add in-app guidance and an easy way for drivers to get support when they needed it.


Paid by the mile
Not for completing tasks → quickly getting on the road is important
Not tech-savvy
They don't over interact with the app → simplicity over cleverness
Rough conditions
Gloves, sun glare, and personal phones →
design needs to be robust
Loading vehicle is hard
Especially for new drivers → provide help where needed
How to add two new tasks without slowing drivers down?
One major change in the new workflow was adding two required tasks: vehicle scanning and damage reporting. These steps were needed to close gaps in inventory tracking and chain of custody.
But they also added new friction to the driver’s workflow. To minimize this impact, I explored multiple workflow options to find the most efficient and intuitive approach.
After comparing three different flows, I landed on a solution that allows drivers to scan and inspect vehicles one by one, then load all vehicles at the end. This approach improved efficiency while maintaining data accuracy.
Flow 1
Flow 2
Flow 3
Scan vehicle #1
Scan vehicle #2
Scan vehicle #n
Inspect vehicle #1
Inspect vehicle #2
Inspect vehicle #n
Damage?
Load vehicle
Load successful?
Damage?
Load vehicle
Load successful?
Damage?
Load vehicle
Load successful?
My thoughts on this flow
Makes drivers go through the vehicle lineup twice, which slows them down
Using AI to move faster, then judgment to find what actually worked
With these insights, I began exploring different user flow concepts. To move quickly, I shared the product brief and my own design prompt with AI to generate a wide range of ideas.
Many of the concepts were too complex or didn’t hold up in real-world conditions. But one direction stood out: a dashboard-style flow that clearly laid out all required tasks in a clear, linear way.
This approach worked well for drivers who are not tech-savvy and need simple guidance, with an interface that is easy to use in field conditions.
I shared this early concept with stakeholders to gather feedback and align on a direction. It became the foundation for the designs, which I continued to refine to meet real needs.


I iterated until driver speed and business accuracy could coexist
I explored multiple iterations for each core screen and workflows.
Across the designs, I was constantly balancing speed versus data quality, flexibility versus structure, and simplicity versus comprehensiveness.
For example, I explored separate versus combined steps for scanning and damage reporting tasks. I chose to combine them into a single flow because it matched how drivers worked in real life.
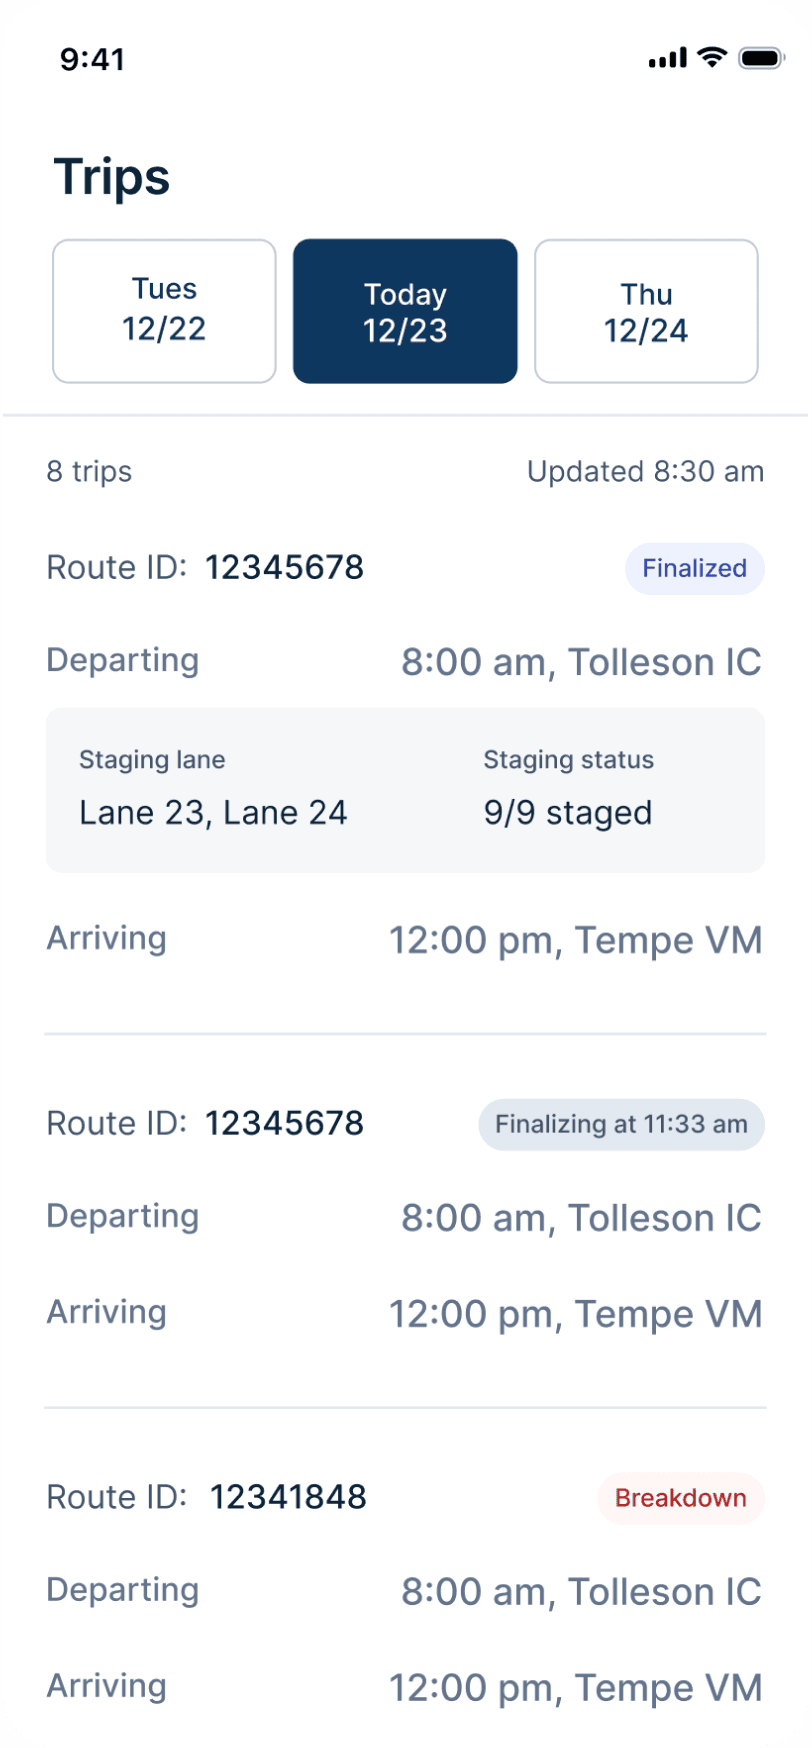
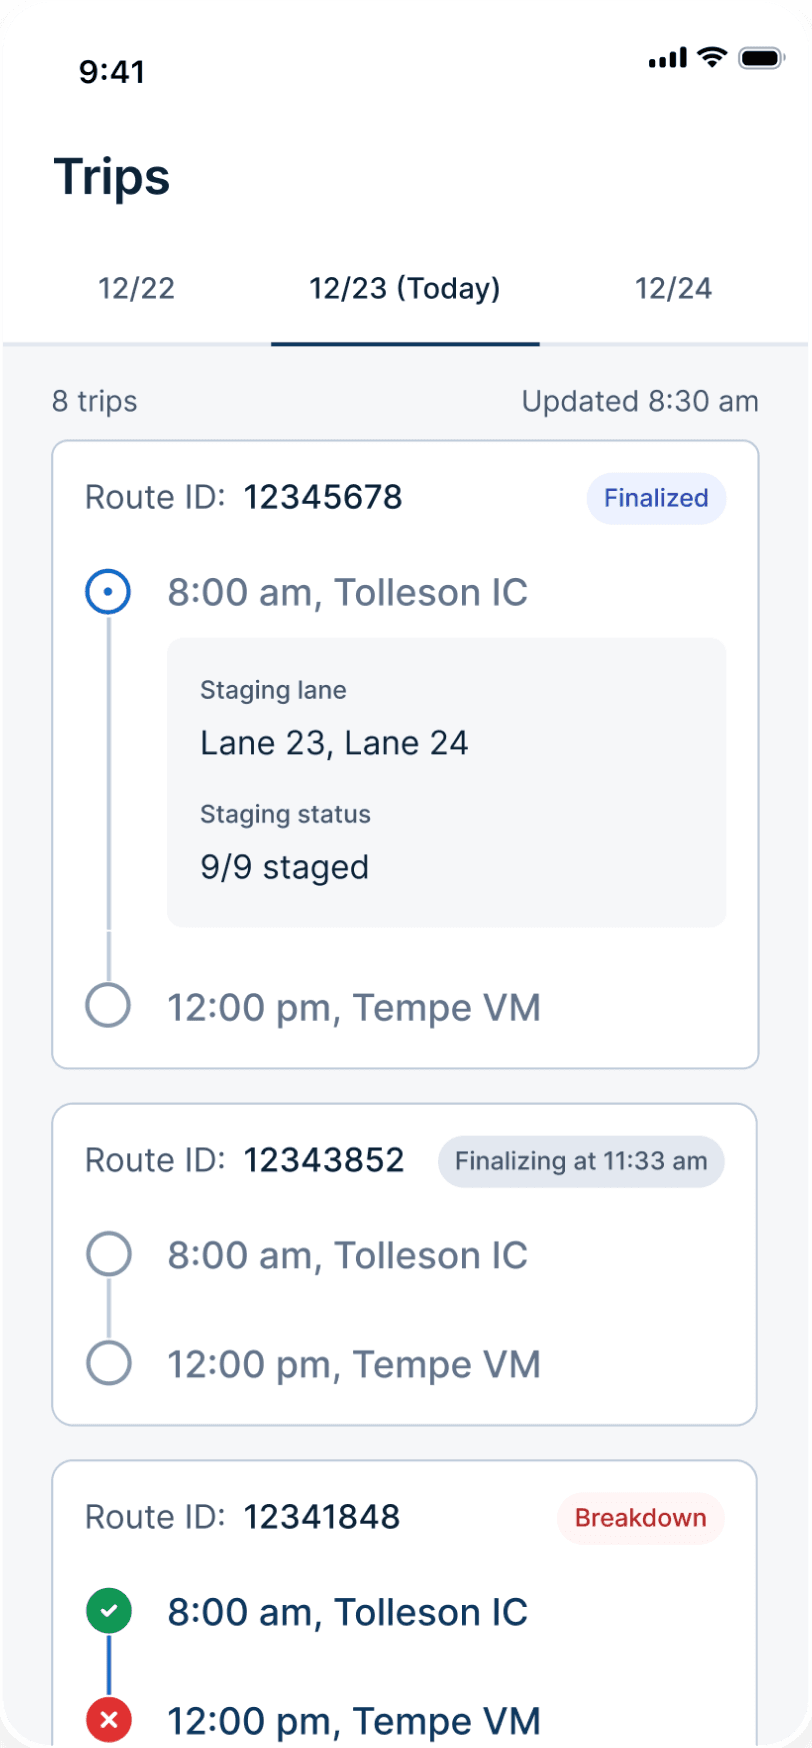
On the Trips screen, I chose clarity over showing too much information so drivers could quickly see what mattered. On the Load Vehicles screen, I explored batch loading for speed but later chose individual loading to reduce errors.
For every decision, I referred back to driver needs and focused on creating designs that were simple, intuitive, and easy to use.
Trips
Trip details
Load vehicles


Final design
Version 1
Reason for choosing the winner
Clear info matters more than saving space in this case
I pushed back where it mattered and conceded where the data said to
Throughout the project, I worked with stakeholders to navigate many trade-offs. User needs and business needs often conflicted, so my job as the designer was to help the team understand the impact of each decision.
I pushed back on decisions that would hurt drivers without clear business value. But I also made compromises when the business value clearly outweighed the impact on drivers.
By referring to user insights and real-world constraints in the conversations, I was able to help stakeholders see the bigger picture and align on the right trade-offs.
Scan + inspect
Keep scan and inspect tasks separate vs. combine them for efficiency.
Product wanted two steps. But it didn’t make sense in practice. I decided to combine scan and inspect into one seamless flow to increase efficiency.
Separated tasks

Combined tasks

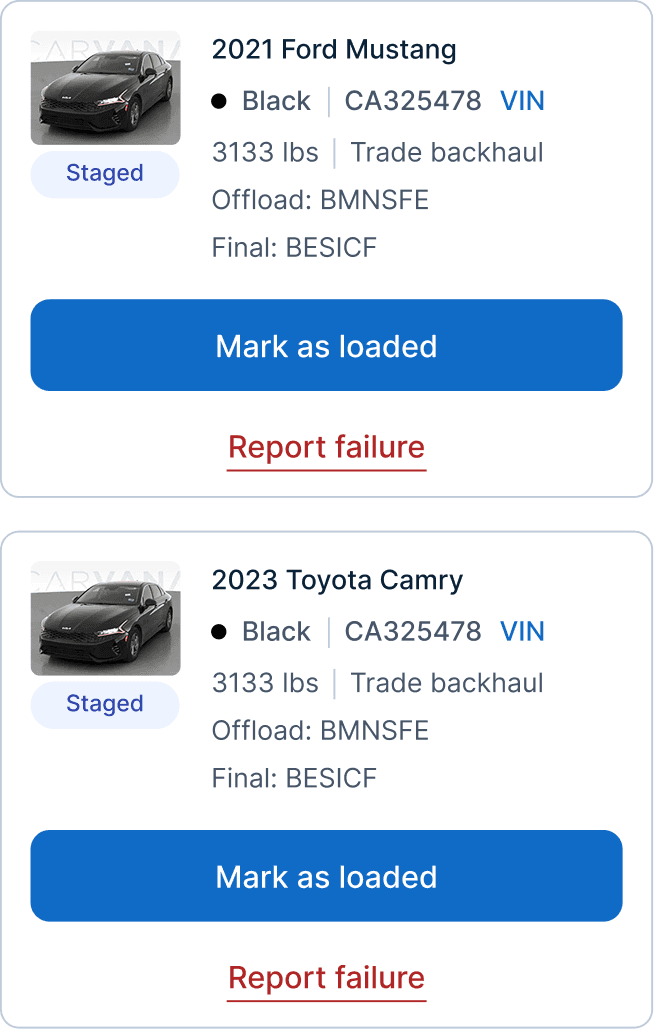
Load vehicles
Batch load for drivers’ speed vs. single load for operational accuracy.
Drivers wanted to load multiple vehicles at once because that’s how they do it. But operations was concerned it would lead to mistakes in reporting damages.
Eventually I conceded since this friction protected the integrity of the damage data and the additional time should be negligible.
Batch load
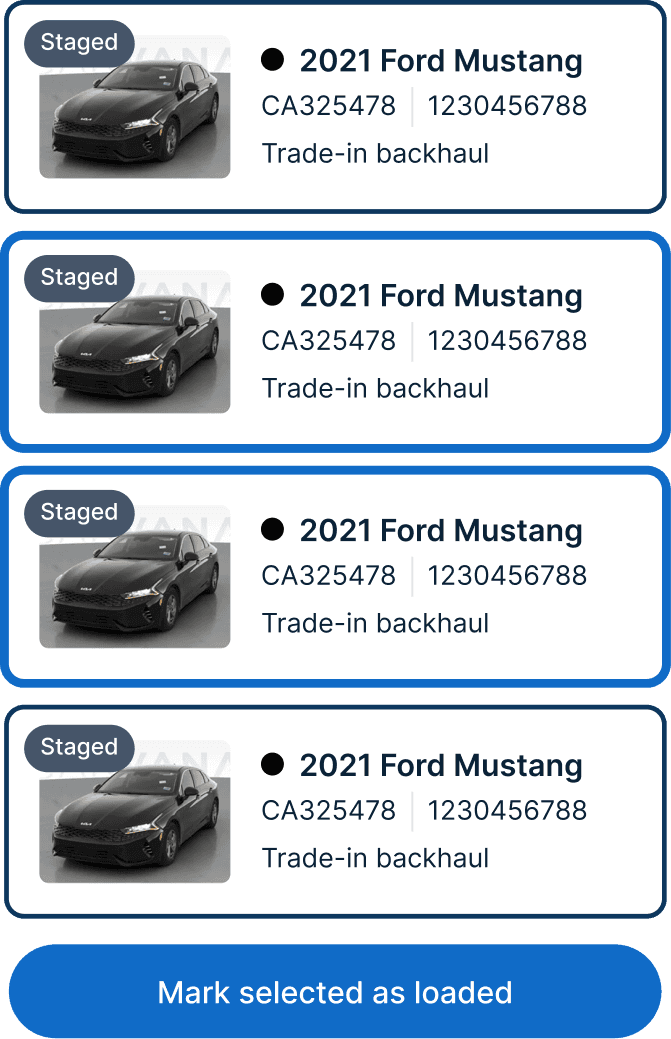
Single load


The results after launch
Since launching Cargo Mobile, drivers are completing trips faster, data accuracy has improved, and unplanned transport has decreased.
26.8%
On-time departures & arrivals
Better trip information and a clearer task flow helped drivers complete their work faster and depart on time.
97.4%
Explicit signals
Up from 80%, drivers now actively confirm departures and arrivals, giving downstream teams accurate, real-time data.
27%
Unplanned transport
Required vehicle scanning helped drivers catch unplanned vehicles before loading, reducing costly transport errors.
Want to see more of my work?
Check out my other case studies, or reach out to me at

